What can make a market optimist less optimistic?
When the sun’s out, and everyone’s singing a happy tune.
And while we’re not there yet, the chorus is getting louder.
That bad recession coming this year? Now it’s a soft landing, or a mild one next year.
Stubborn inflation that won’t ease because the Fed is clueless and late to the game? The numbers keep getting better.
Banking crisis that will spread through the economy? I actually forgot about this and had to be reminded about it the other day.
The potential debt default? It morphed into a Fitch downgrade that the market shrugged off and Jamie Dimon and Warren Buffett told you to ignore.
Those pessimistic S&P price targets? Revised upwards. In some cases by a lot.
It’s easier to be optimistic in the face of rampant pessimism.
Why?
Because markets and economies want to grow, and the pessimistic overdose never seems to happen before declines (only well into an existing ones).
Excess pessimism isn’t a reliable indicator that bad things are on the way.
More people lost money waiting for corrections and anticipating corrections than the actual corrections.
Peter Lynch
So, what now?
Am I pessimistic the markets will crash?
You know better.
Bull markets are born on pessimism, grown on skepticism, mature on optimism and die on euphoria. The time of maximum pessimism is the best time to buy, and the time of maximum optimism is the best time to sell.
John Templeton
I’m cautiously optimistic now. We could be entering the next Templeton phase where optimism churns this thing higher, or not. No one knows.
All you can control is your reactions. Don’t get burned.
Either by FOMO induced performance chasing.
Or by overreacting to setbacks along the way.
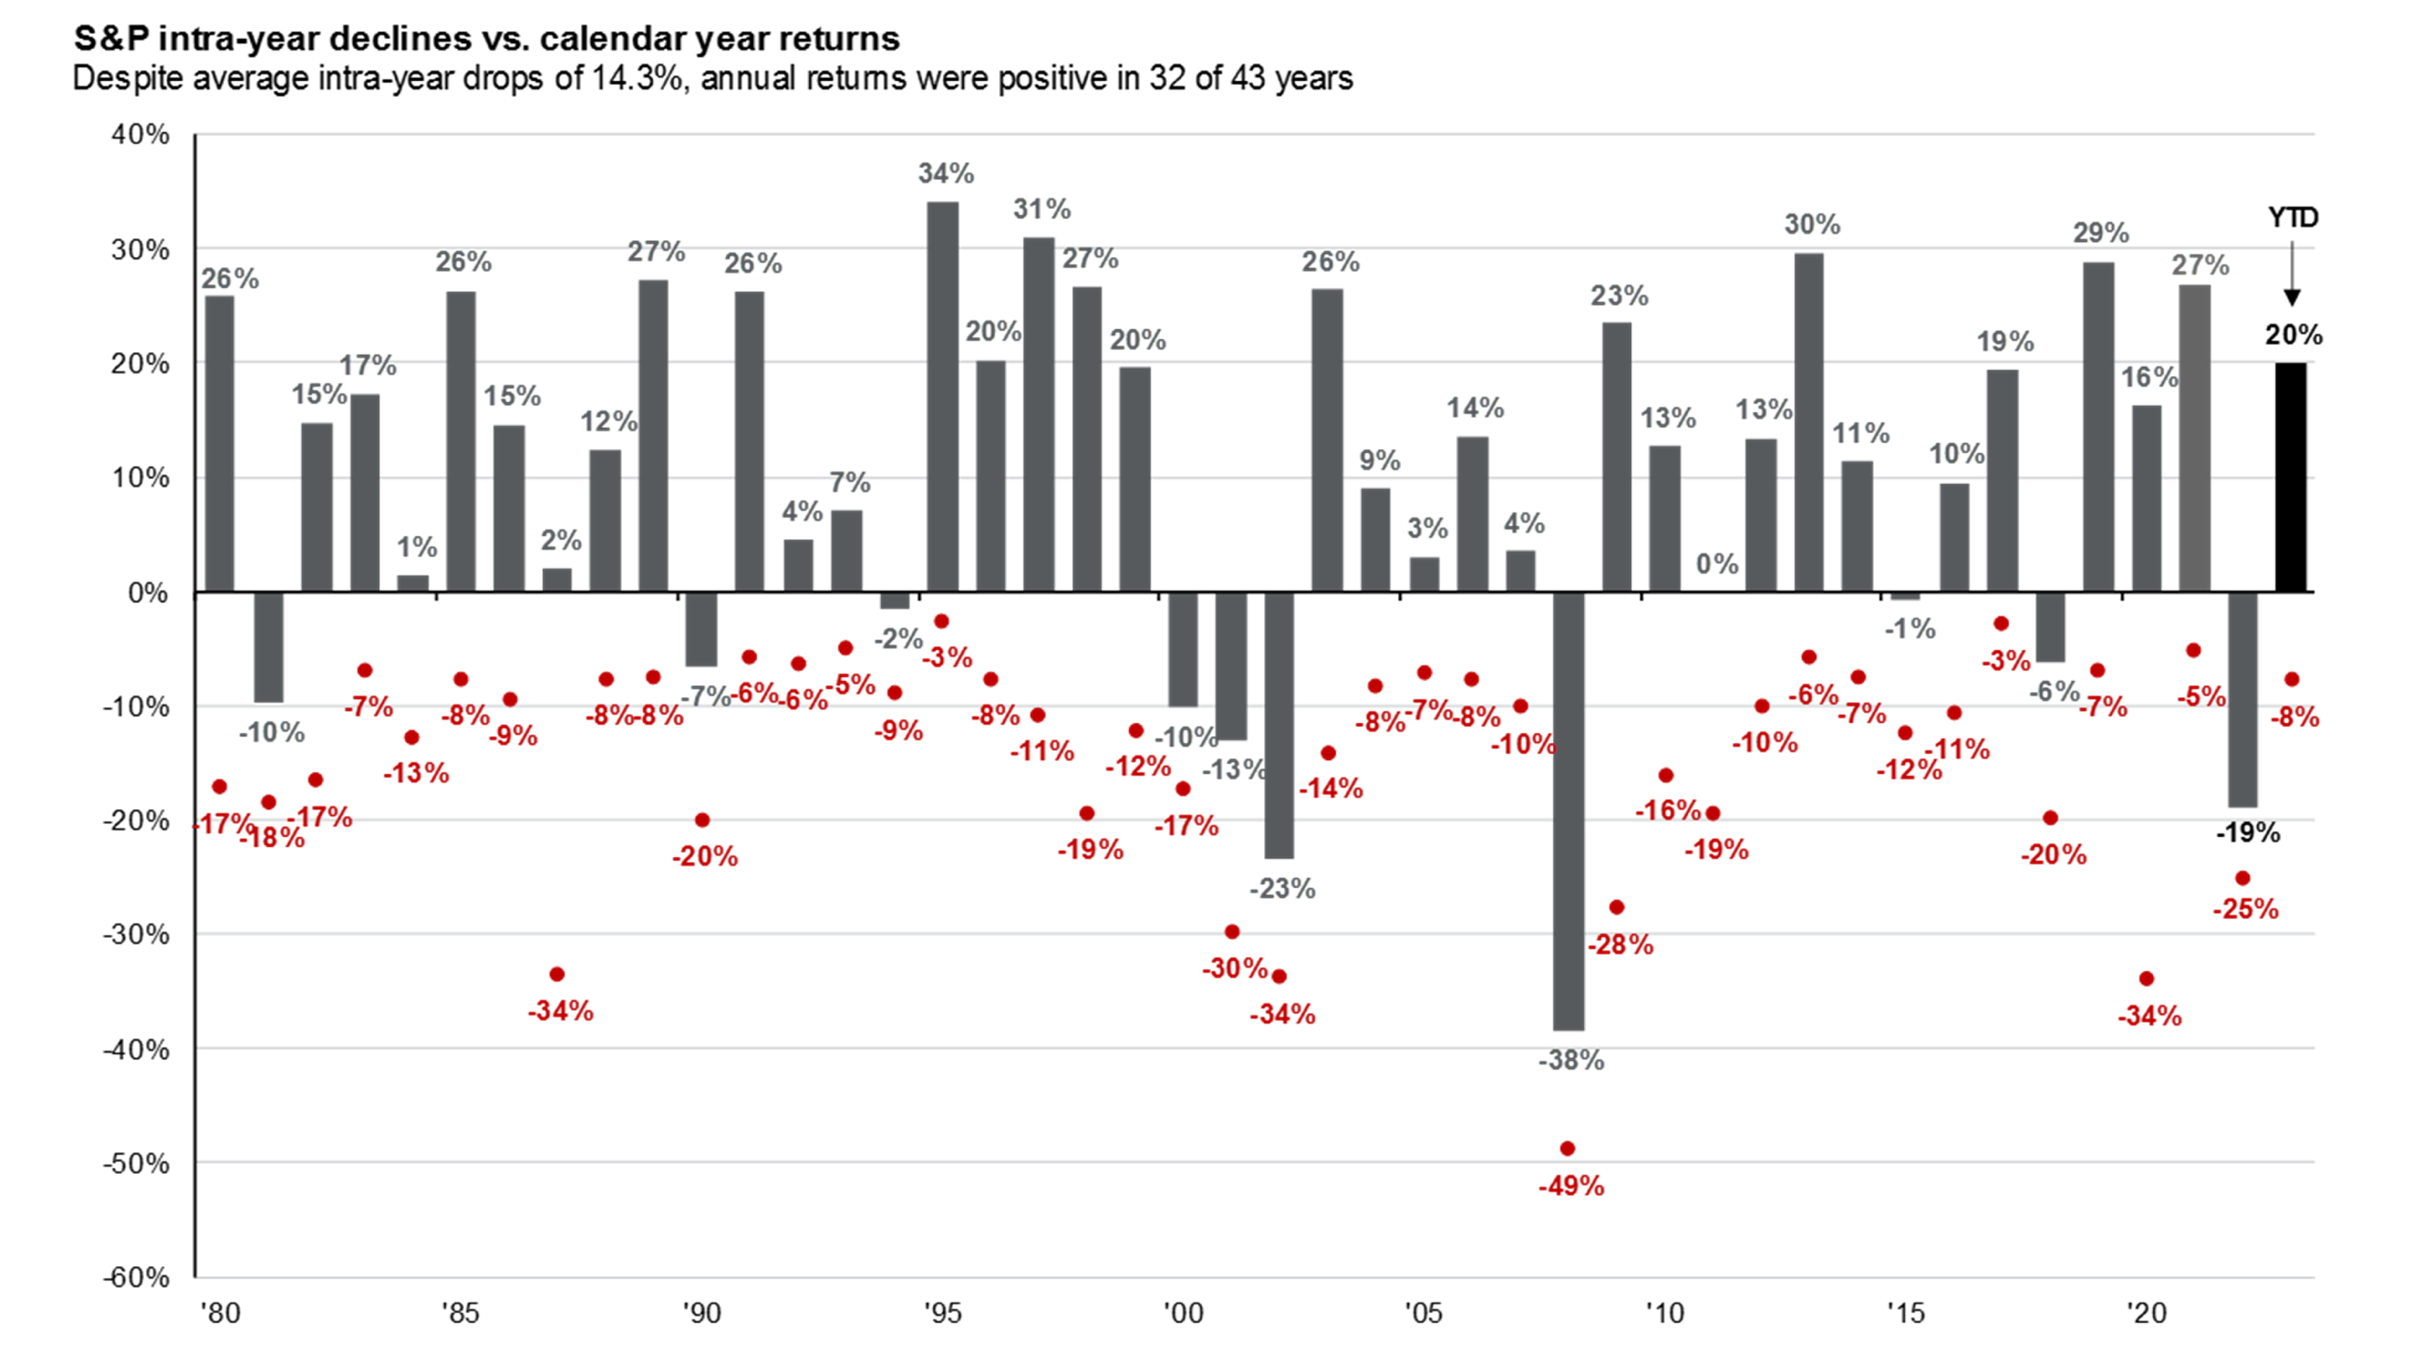
Source: Guide to the Markets – J.P. Morgan Asset Management – Source: FactSet, Standard & Poor’s, J.P. Morgan Asset Management. Returns are based on price index only and do not include dividends. Intra-year drops refers to the largest market drops from a peak to a trough during the year. For illustrative purposes only. Returns shown are calendar year returns from 1980 to 2022, over which time period the average annual return was 8.7%. Guide to the Markets – U.S. Data are as of July 31, 2023.
Short-term volatility is the cost of doing business in a bull market. The market averages a 14.3% intra-year decline every year.
Expect declines, big ones.
Ignore them.
Not every 10% move down will be a 2008 or 2022.