Charts You Need to See – Q1 2022 Market Guide
Every quarter, J.P. Morgan Asset Management puts out their Guide to the Markets slide deck. It’s a great source of interesting and helpful information about the economy, markets, and investing. Here are the Q1 2022 market guide slides that stood out to me and how they may help you.
The Charts
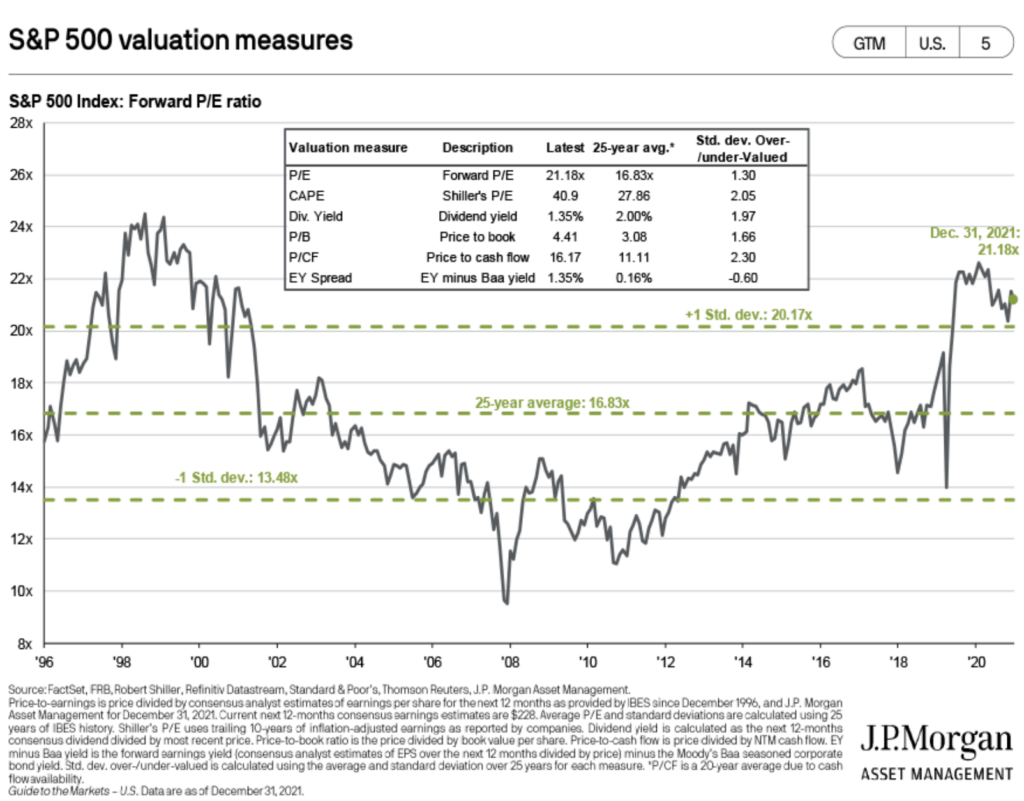
Looking at different valuation measures for the S&P 500 indicates that U.S. large cap stocks are expensive relative to history, albeit by different degrees depending on your chosen valuation method. Interesting to note the EY Spread. Comparing the earnings yield on stocks to what you can get in corporate bond yields is a way of adjusting for the low interest rate environment. Earnings Yield is the inverse of P/E ratios – earnings divided by price. In a low rate environment, like the one we are in, stocks are arguably more attractive. That’s what the EY spread is showing.
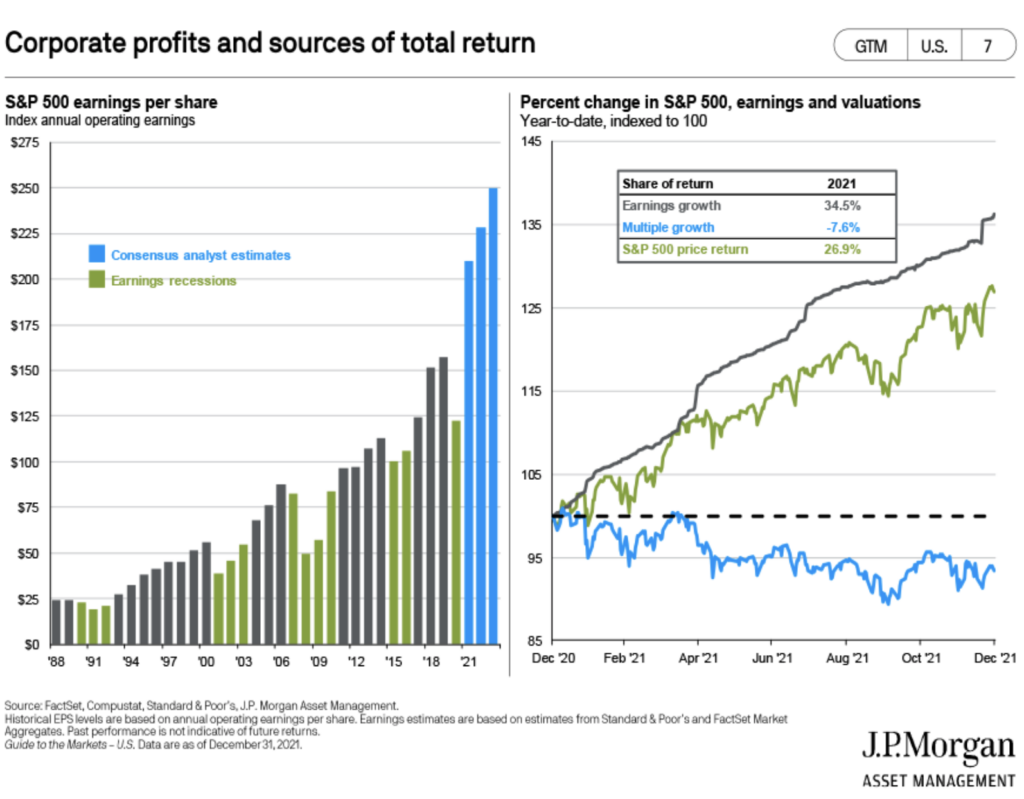
Another chart to put U.S. large cap stocks performance and expense in context. Earnings per share have grown and last year’s return was driven by earnings growth and not people being willing to pay more for those earnings.
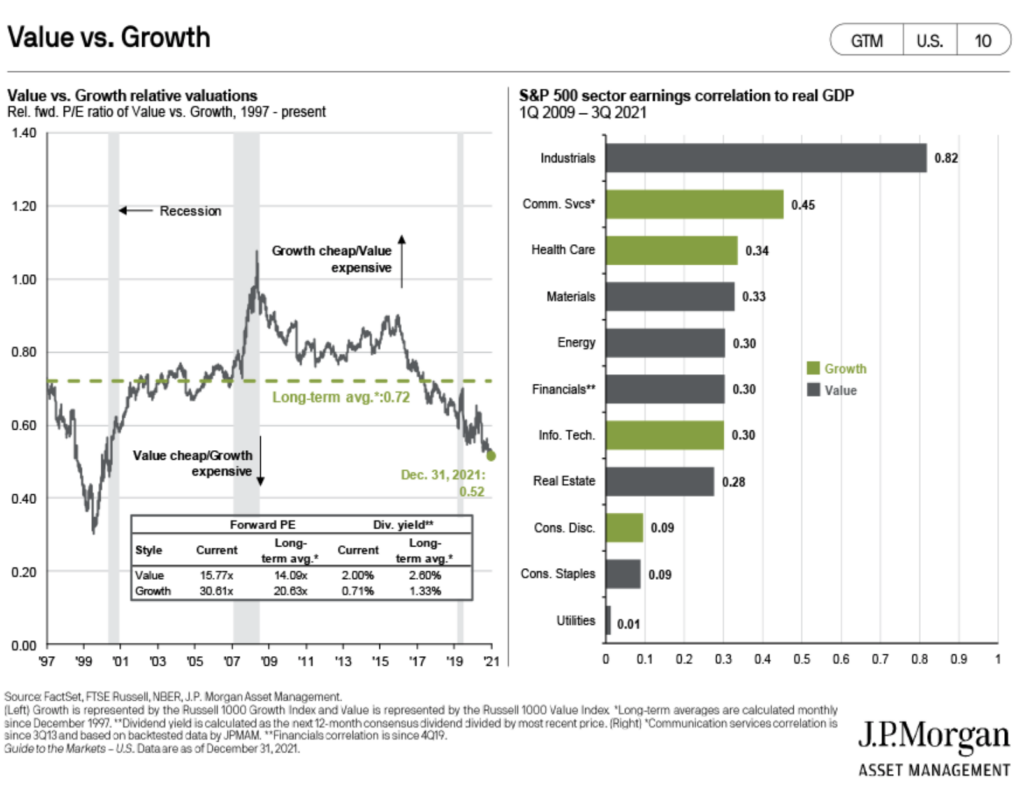
The chart on the left shows that value stocks are still cheap relative to growth stocks.
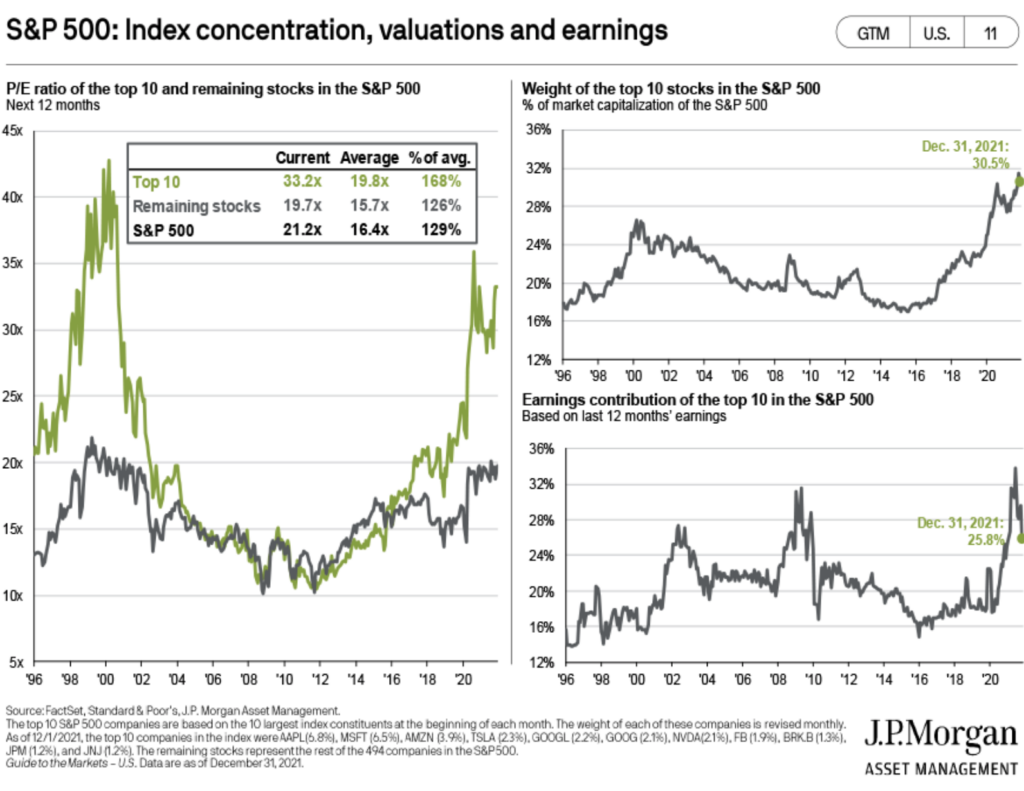
Concerned about valuations and the market? Diversify. The top ten names in the S&P 500 are far more expensive than the rest of the market, are a bigger share of the index than they were before, and are a large contributor to the S&P 500’s earnings.
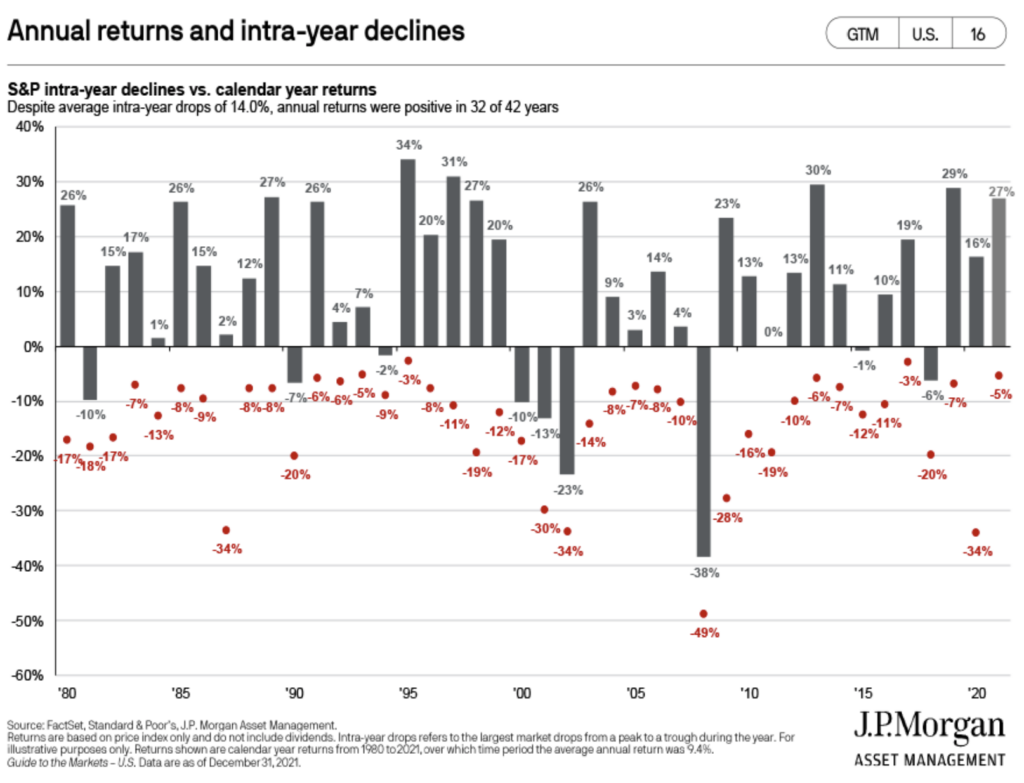
This is one of my favorite slides in the Q1 2022 market guide. Over the last forty years, the market averages a 14% intra-year decline. You have to expect annual double digit corrections every year as a stock market investor and learn not to overreact to them. We did not have one last year.
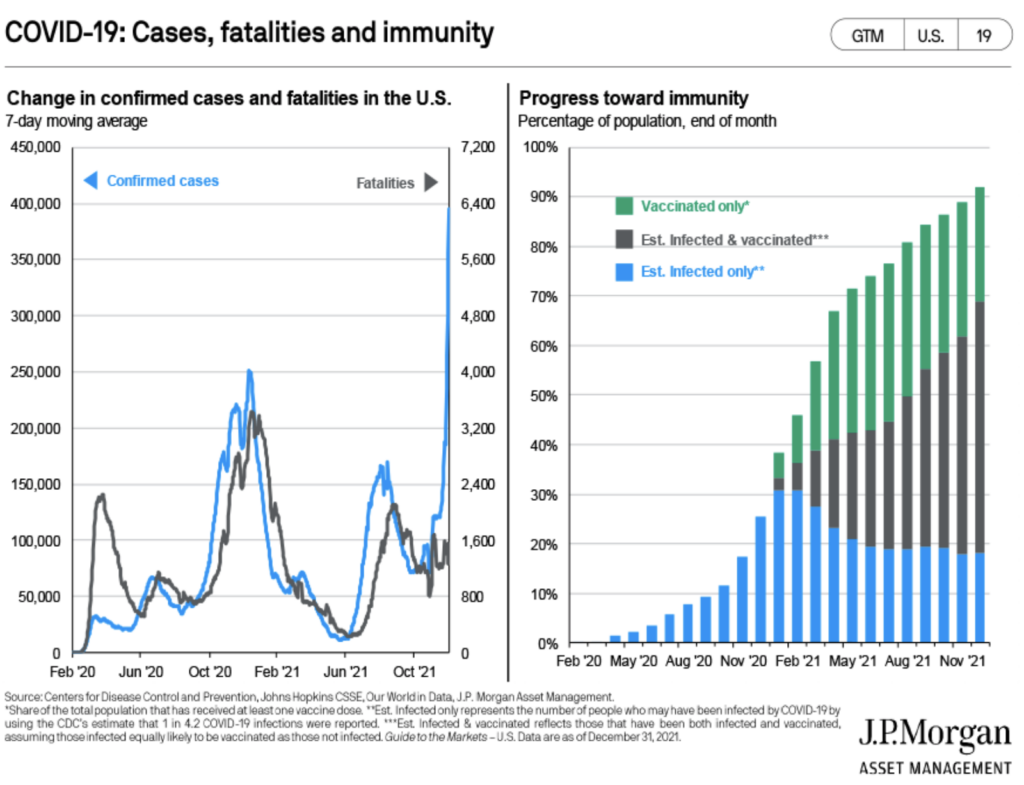
COVID-19 update.
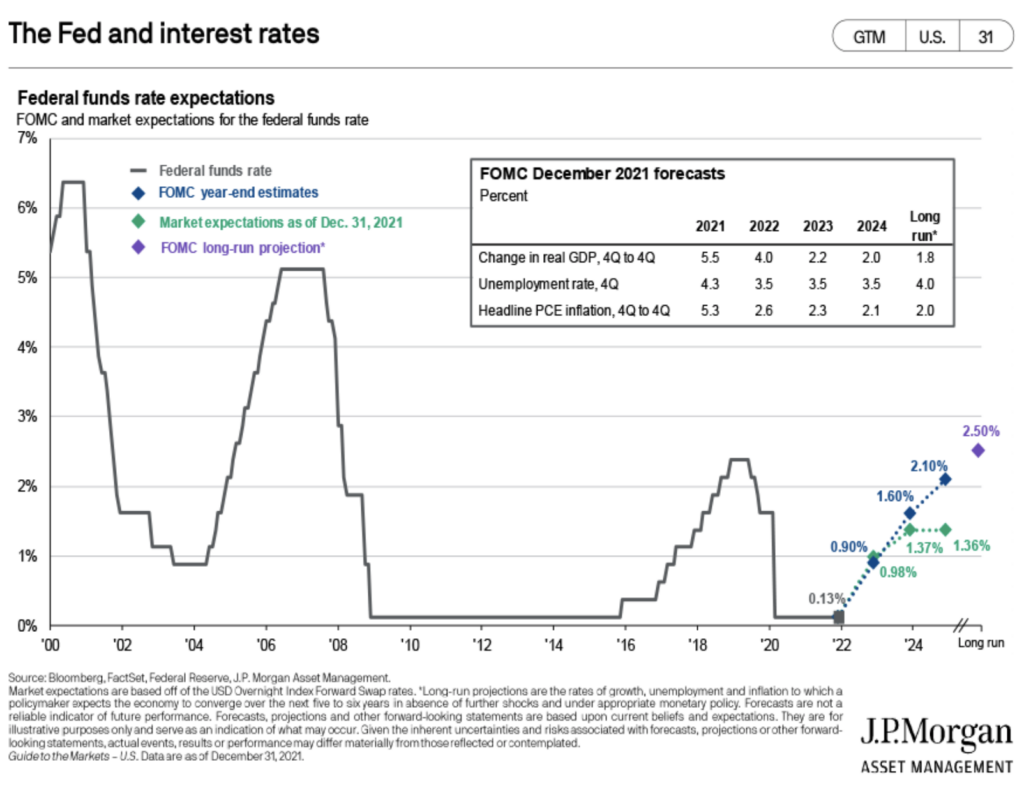
I’ve written about why it’s important to Watch (and not fight) the Fed. Here are Federal funds rate expectations for the next few years.
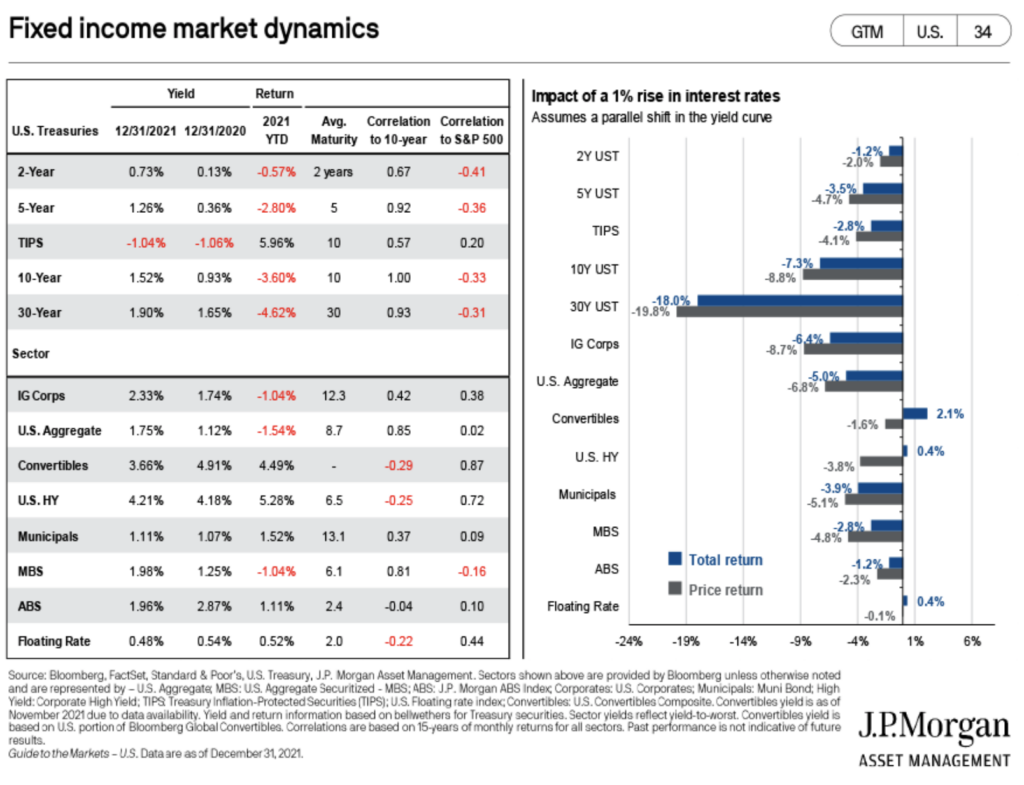
Bonds have struggled this year, which is the chart on the left. If rates increase, bonds will continue to struggle, which is the chart on the right. Here’s what you can do instead of watching your bonds struggle. 5 Portfolio Changes to Consider Now.
Another favorite. Don’t let short-term volatility shake you out of earning the market’s long-term returns.
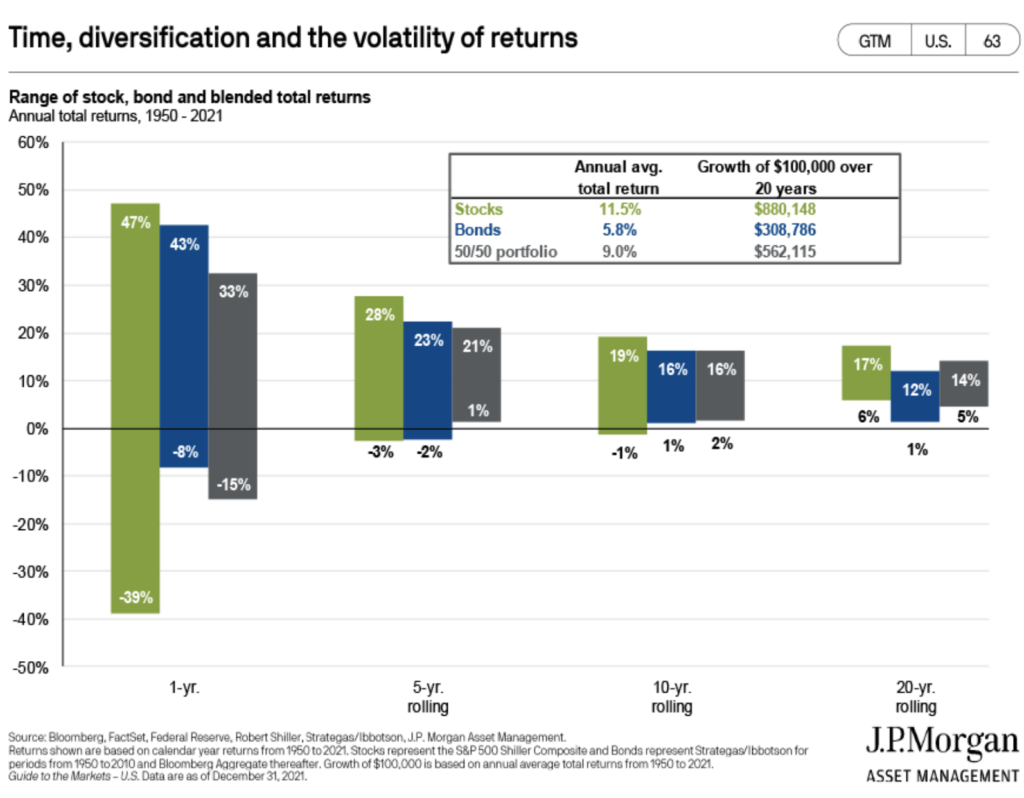
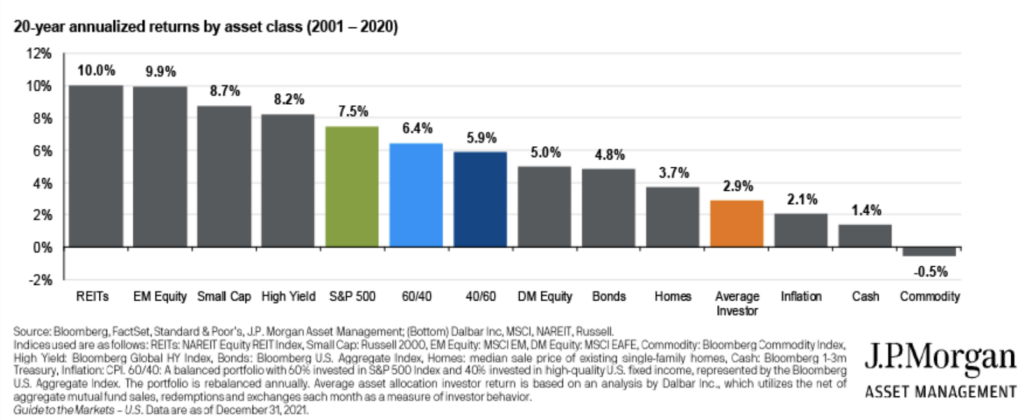
Patience continued…the average investor underperforms almost every type of investment by poor timing decisions and chasing winners.
Wondering how long to give an investment strategy so you don’t jump ship at the wrong time? Check out How Long to Give an Investment Strategy.
Learn more at our market outlook webinar.
January 25, 2022 11:00 am – 12:00 pm
Join me and Heritage’s Chief Investment Officer, Bob Weisse, CFA, CFP®, as we share our expectations for stock and bond markets in 2022 and thoughts on less traditional investment strategies that will be important for meeting your goals over the next 12 months.
