The first three months of 2022 brought some interesting investment developments.
- The first stock market correction in 23 months
- Bonds continued their 2021 struggles
- Growth stocks rolled over
- A potential market rout turned into a late quarter comeback
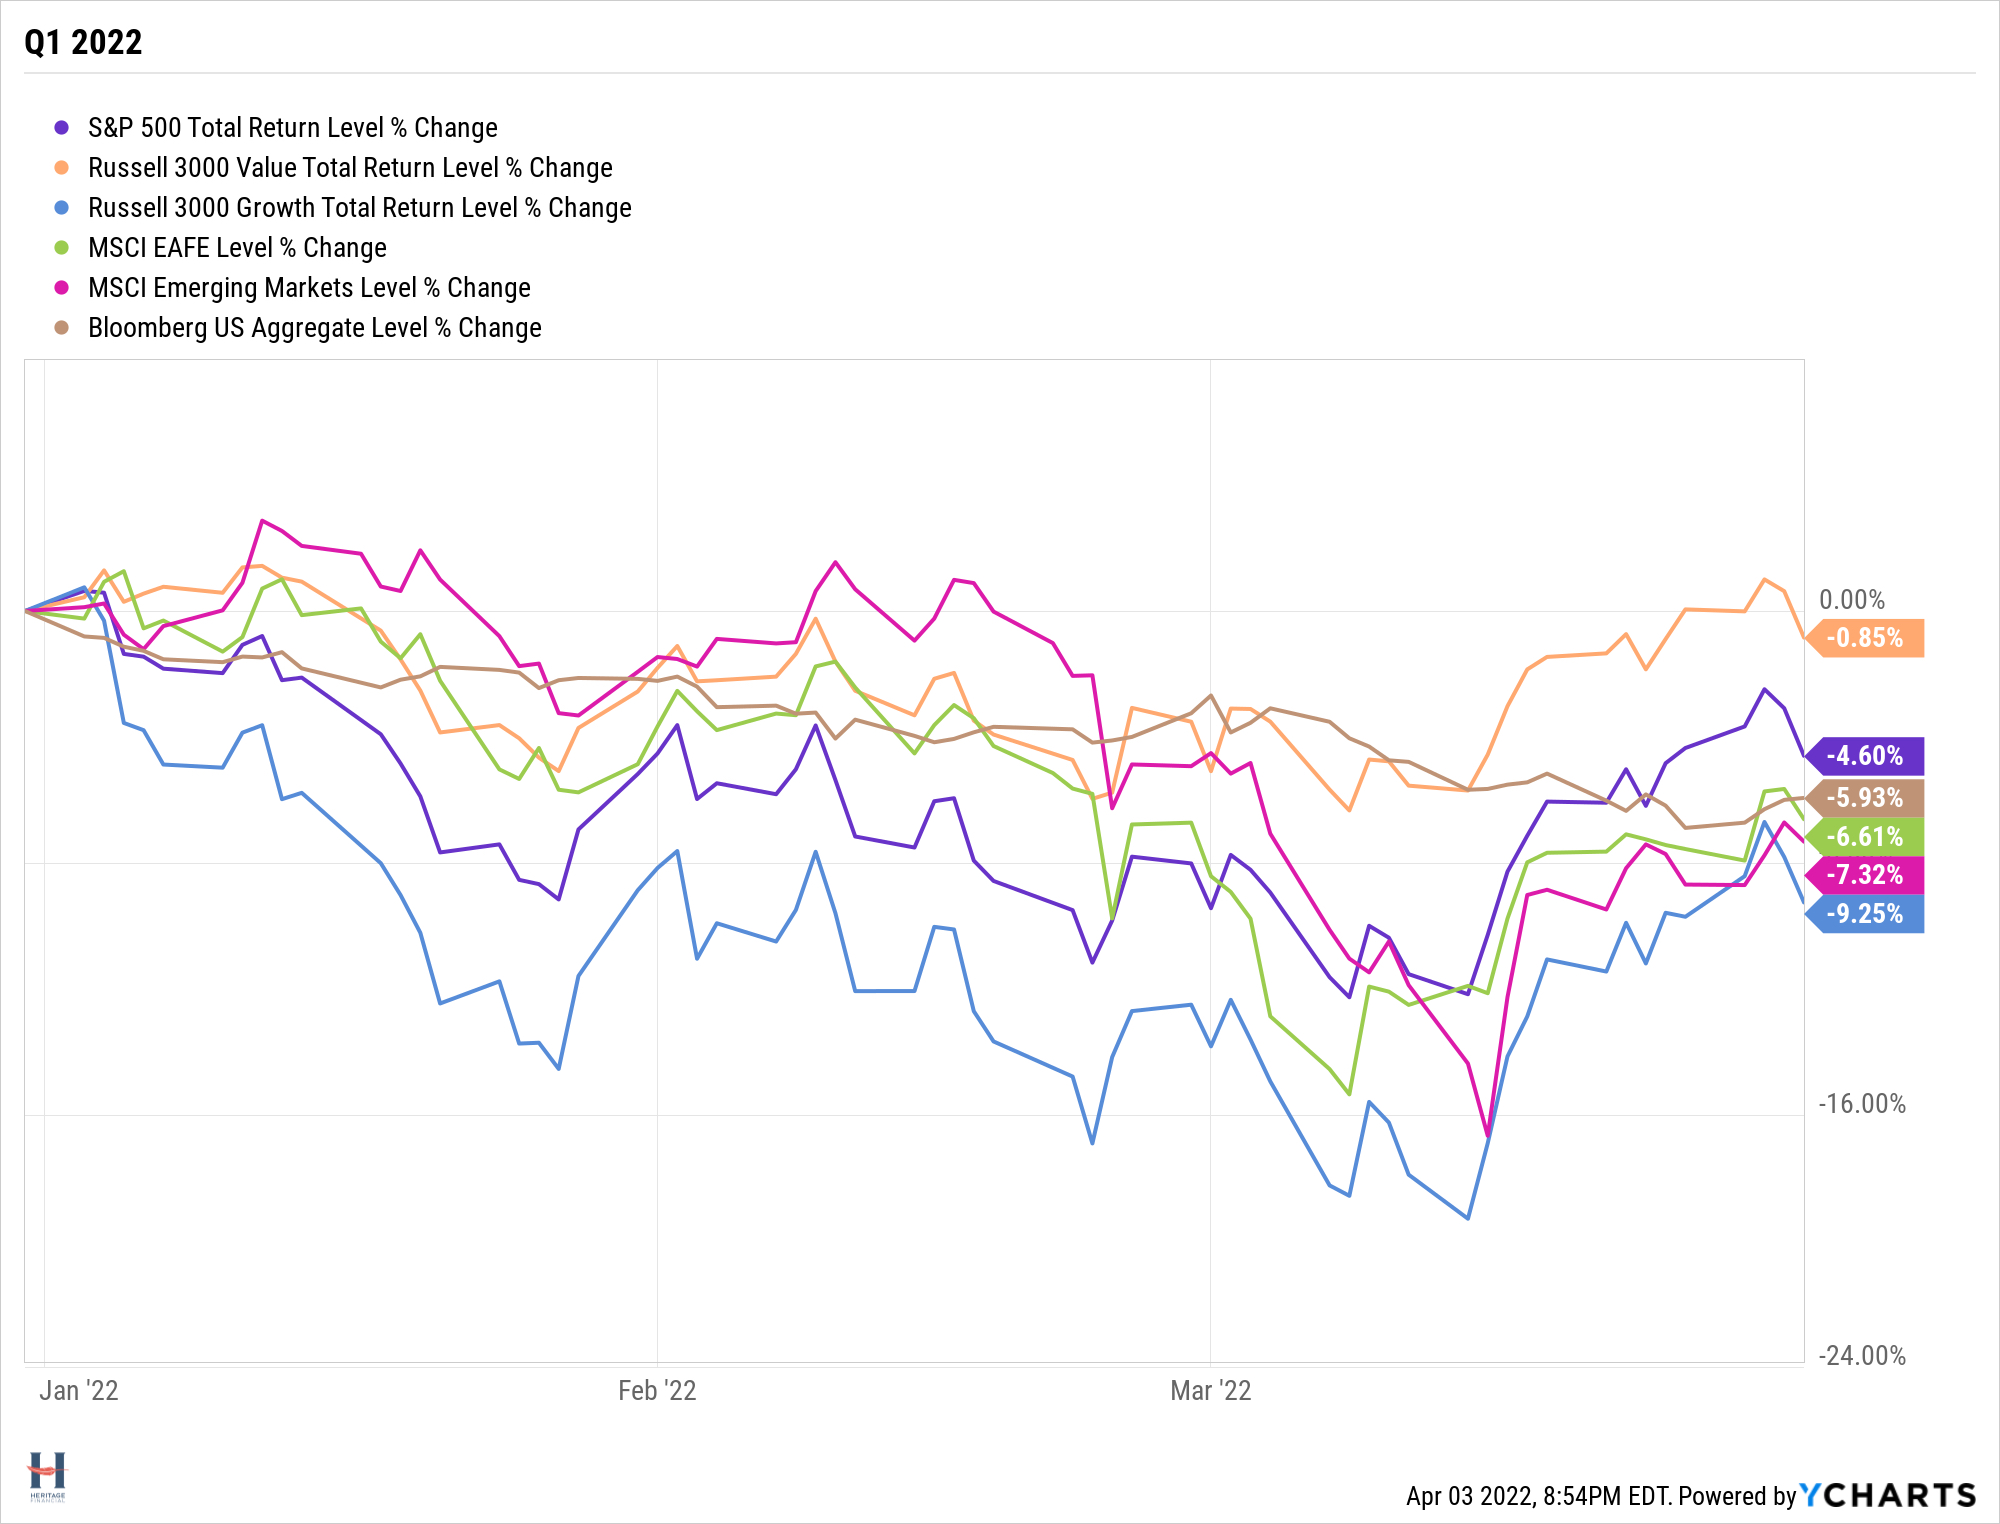
The S&P 500 was down 4.6%.
U.S. growth stocks were down more (9.25%), and U.S. value stocks were down less (.85%).
International stocks were down more than the S&P 500, but not as much as U.S. growth stocks. However, those struggles came as a result of the Ukraine invasion, as both Developed International stocks (MSCI EAFE) and Emerging Markets stocks (MSCI Emerging Markets) were outperforming the U.S. market before then.
U.S. bonds were down 5.93%.
Where do we go from here? My short-term crystal ball has never worked. But every quarter, J.P. Morgan Asset Management puts out their Guide to the Markets slide deck.
Here are the Q2 2022 market guide charts that stood out to me as things to watch or learn from going forward.
The Charts
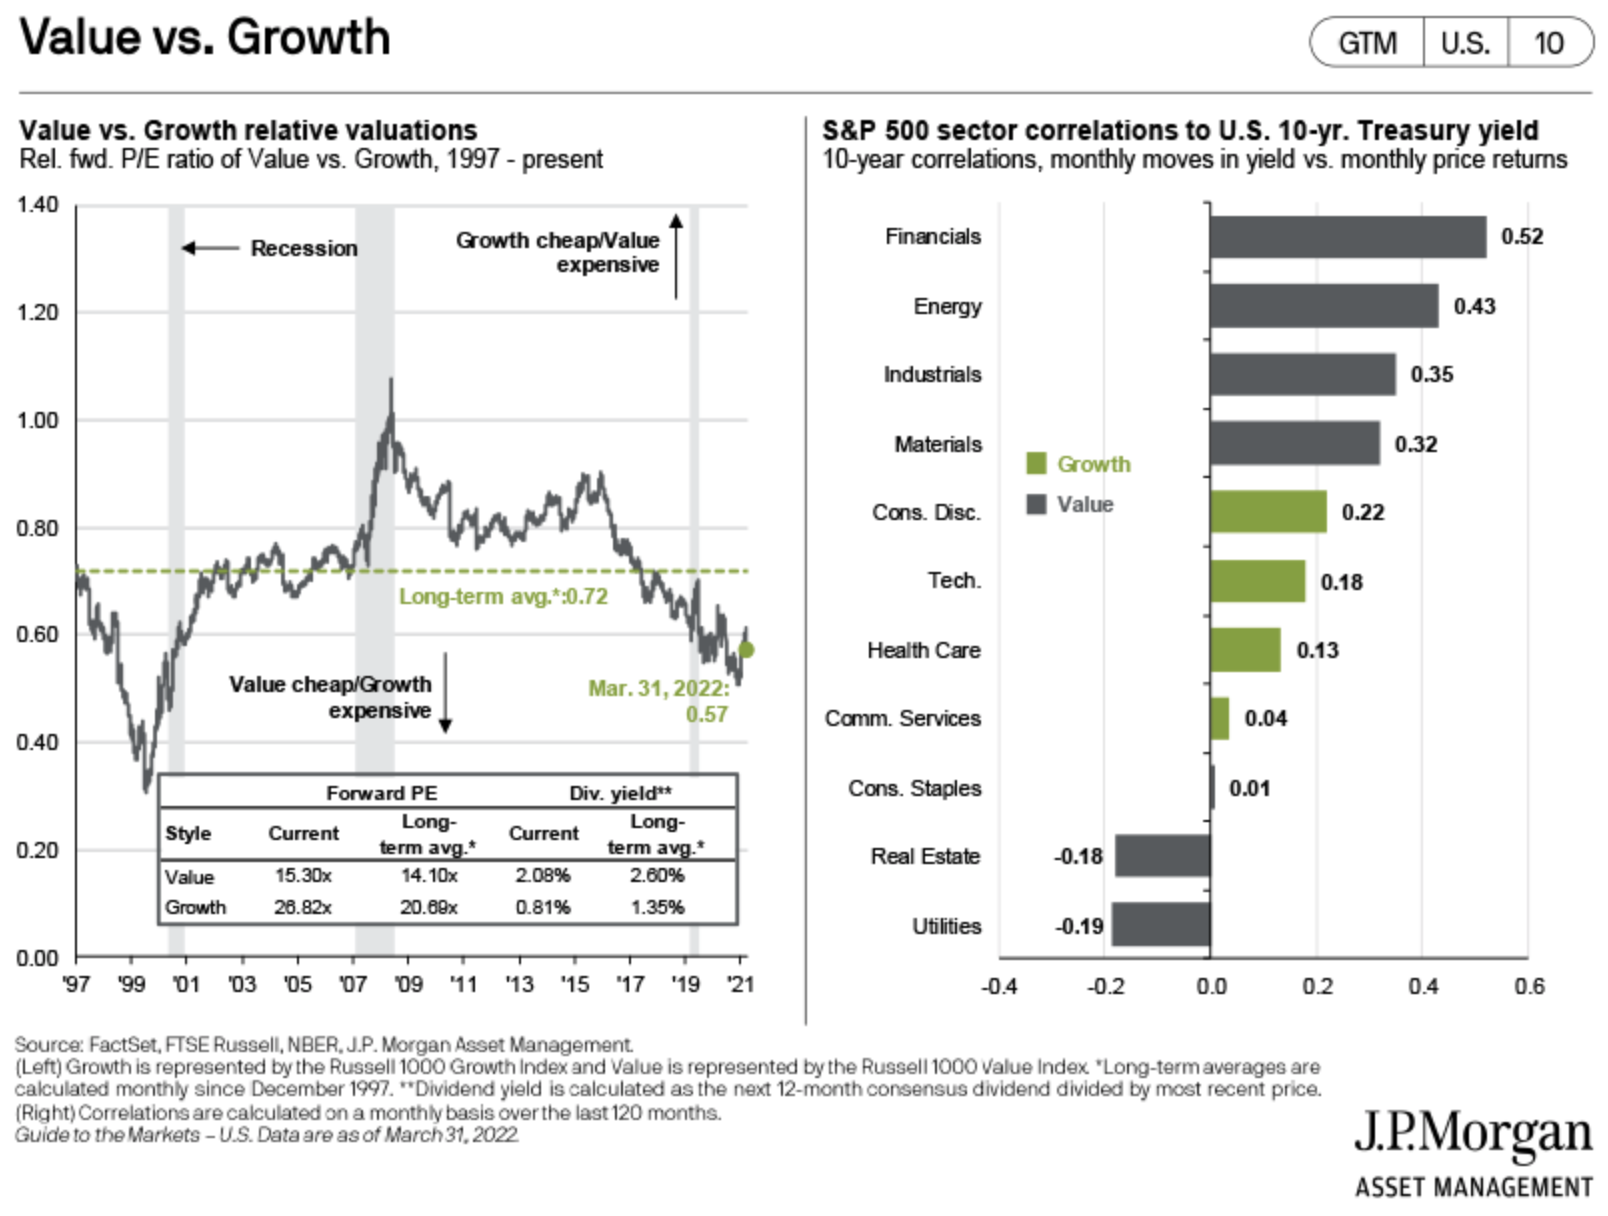
The chart on the left shows that growth is still expensive relative to value, even though value has performed well recently. The chart on the right shows how different market sectors’ performance correlates to the 10-yr. Treasury Yield. Expect yields to continue to increase? Value-oriented sectors could do well.
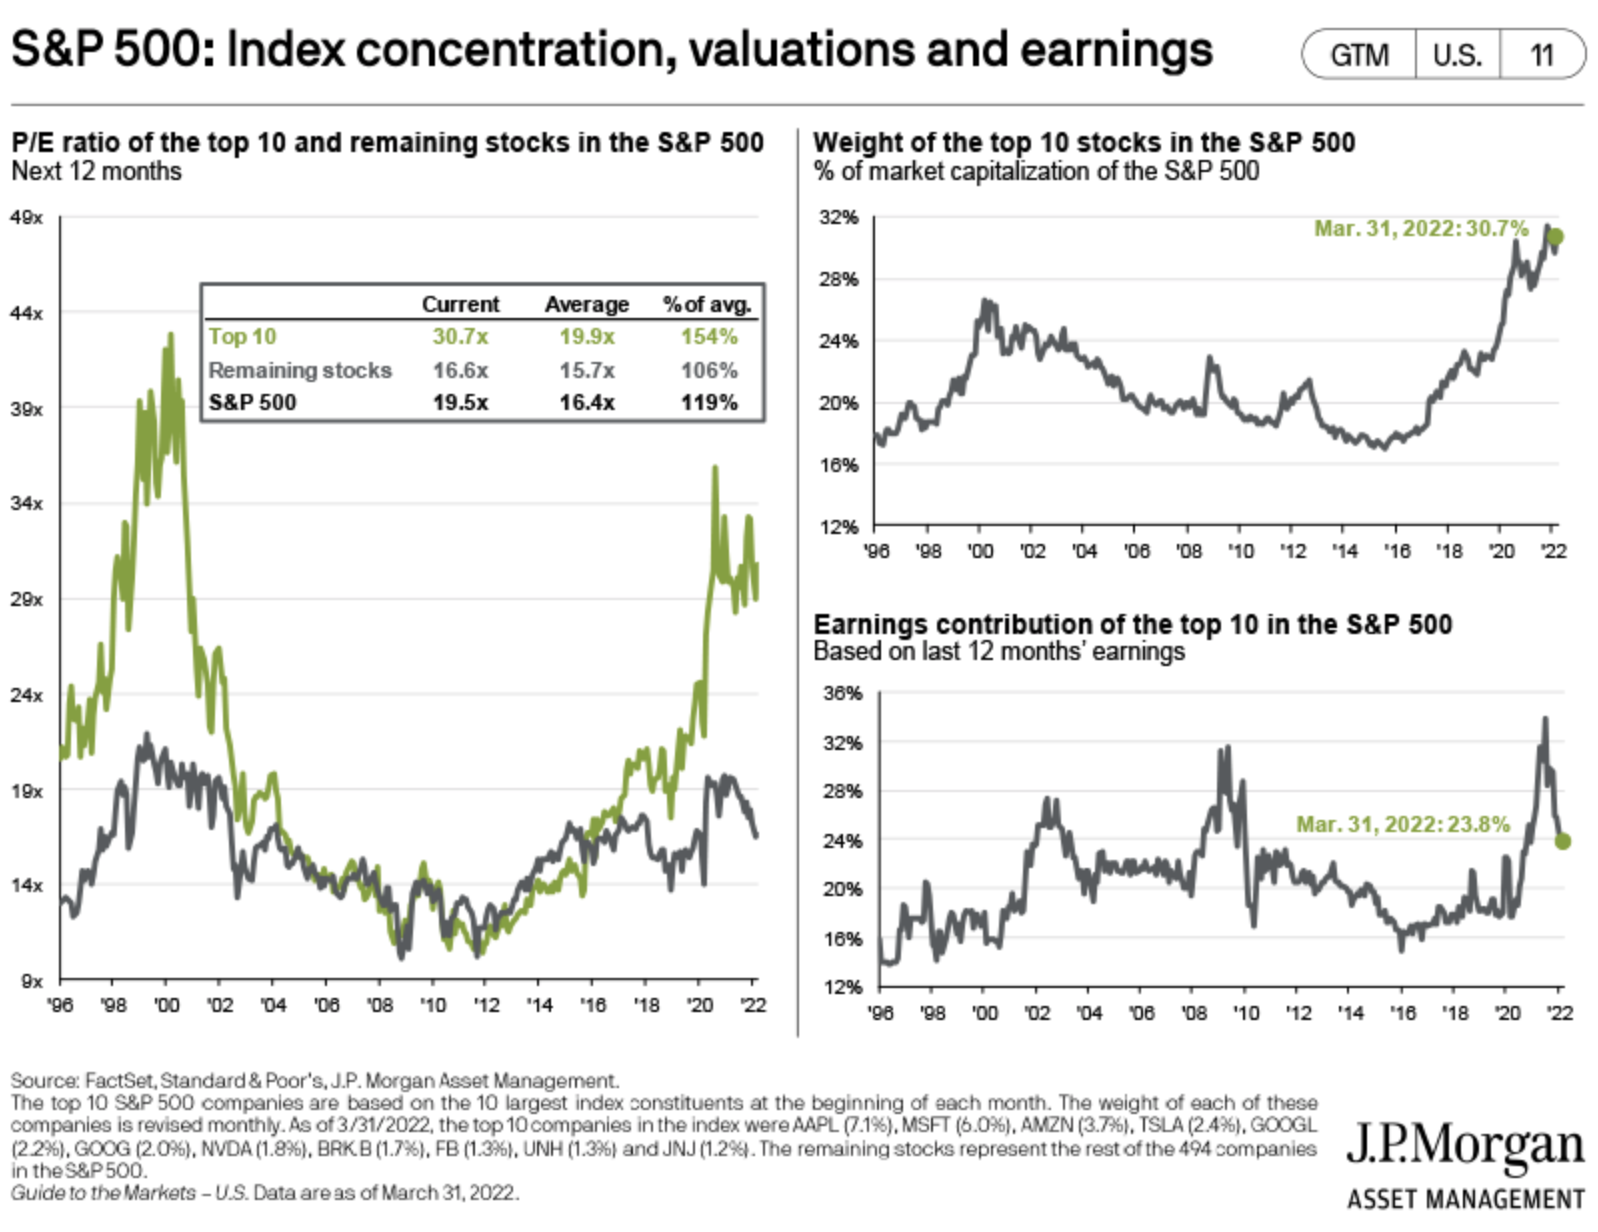
Concerned about valuations and the market? Diversify. The top ten names in the S&P 500 are far more expensive than the rest of the market, are a bigger share of the index than they were before, and are a large contributor to the S&P 500’s earnings.
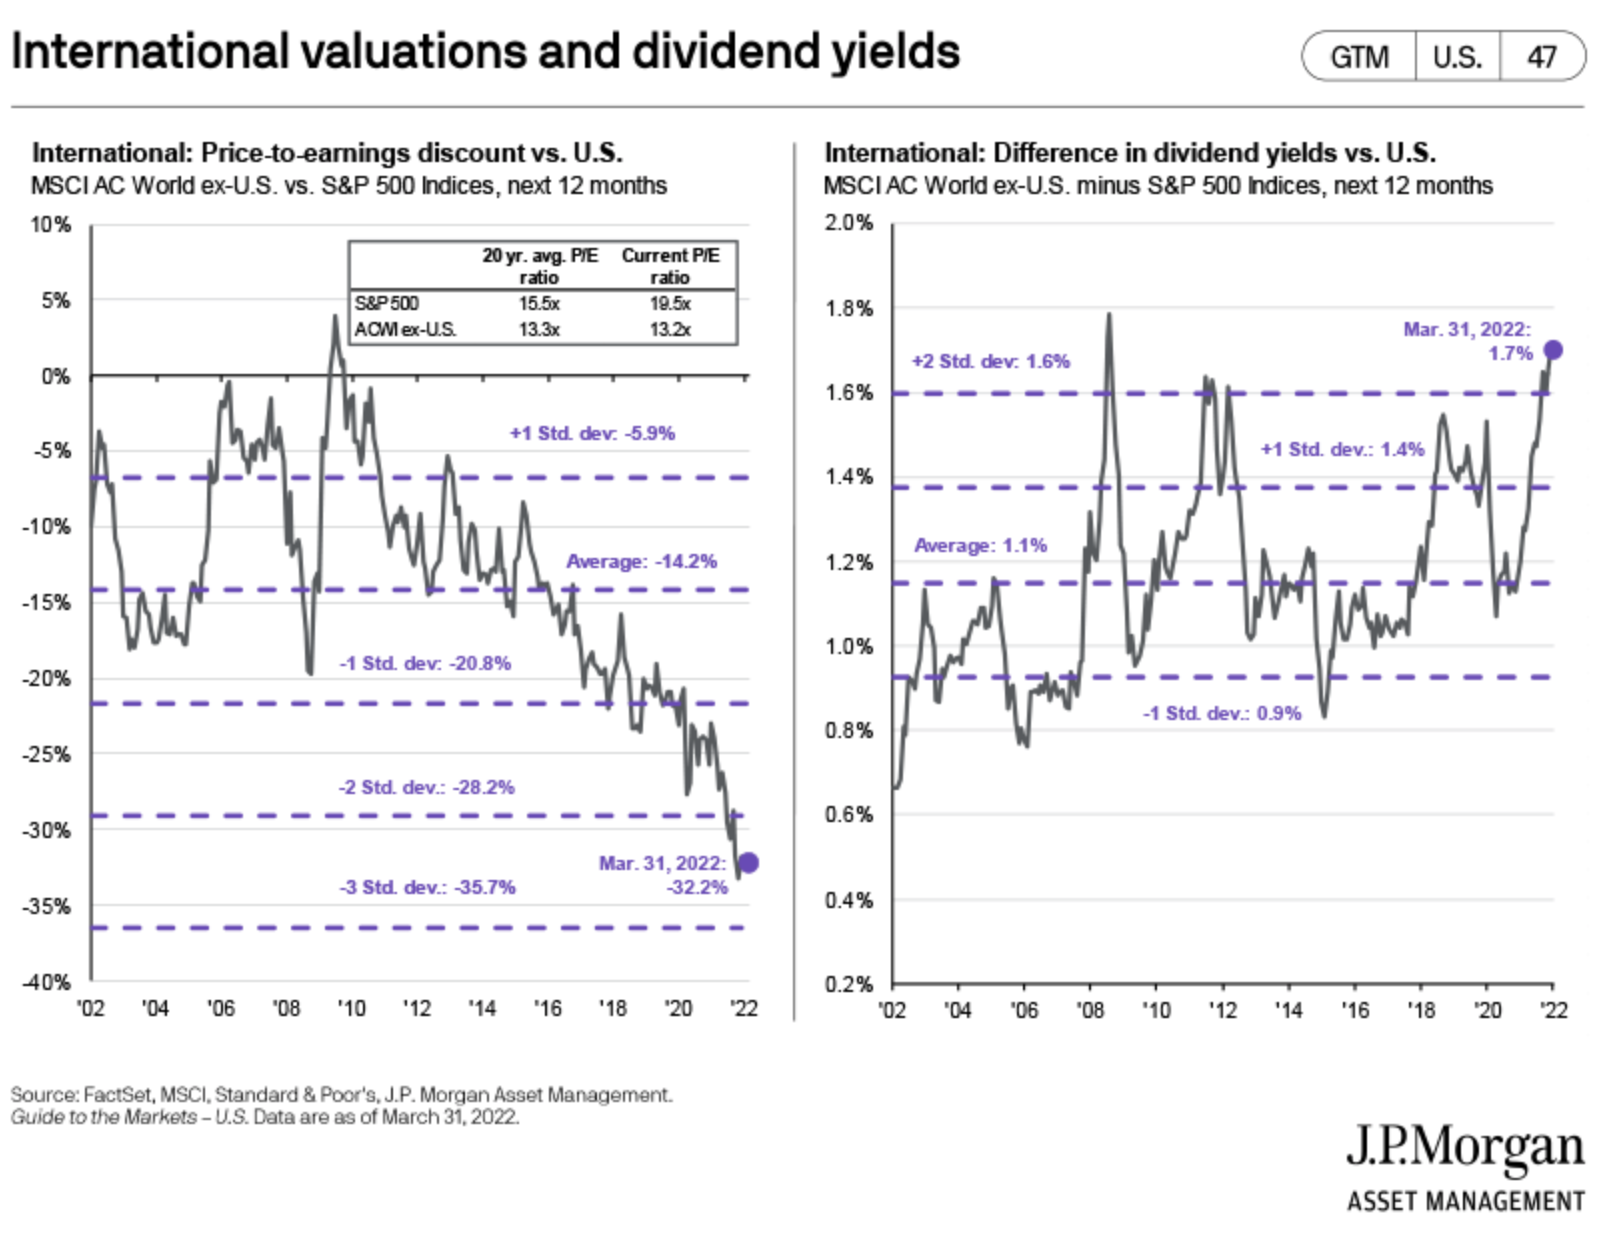
International stocks are cheaper than U.S. stocks, cheaper than their long-term average, and also have attractive dividend yields.
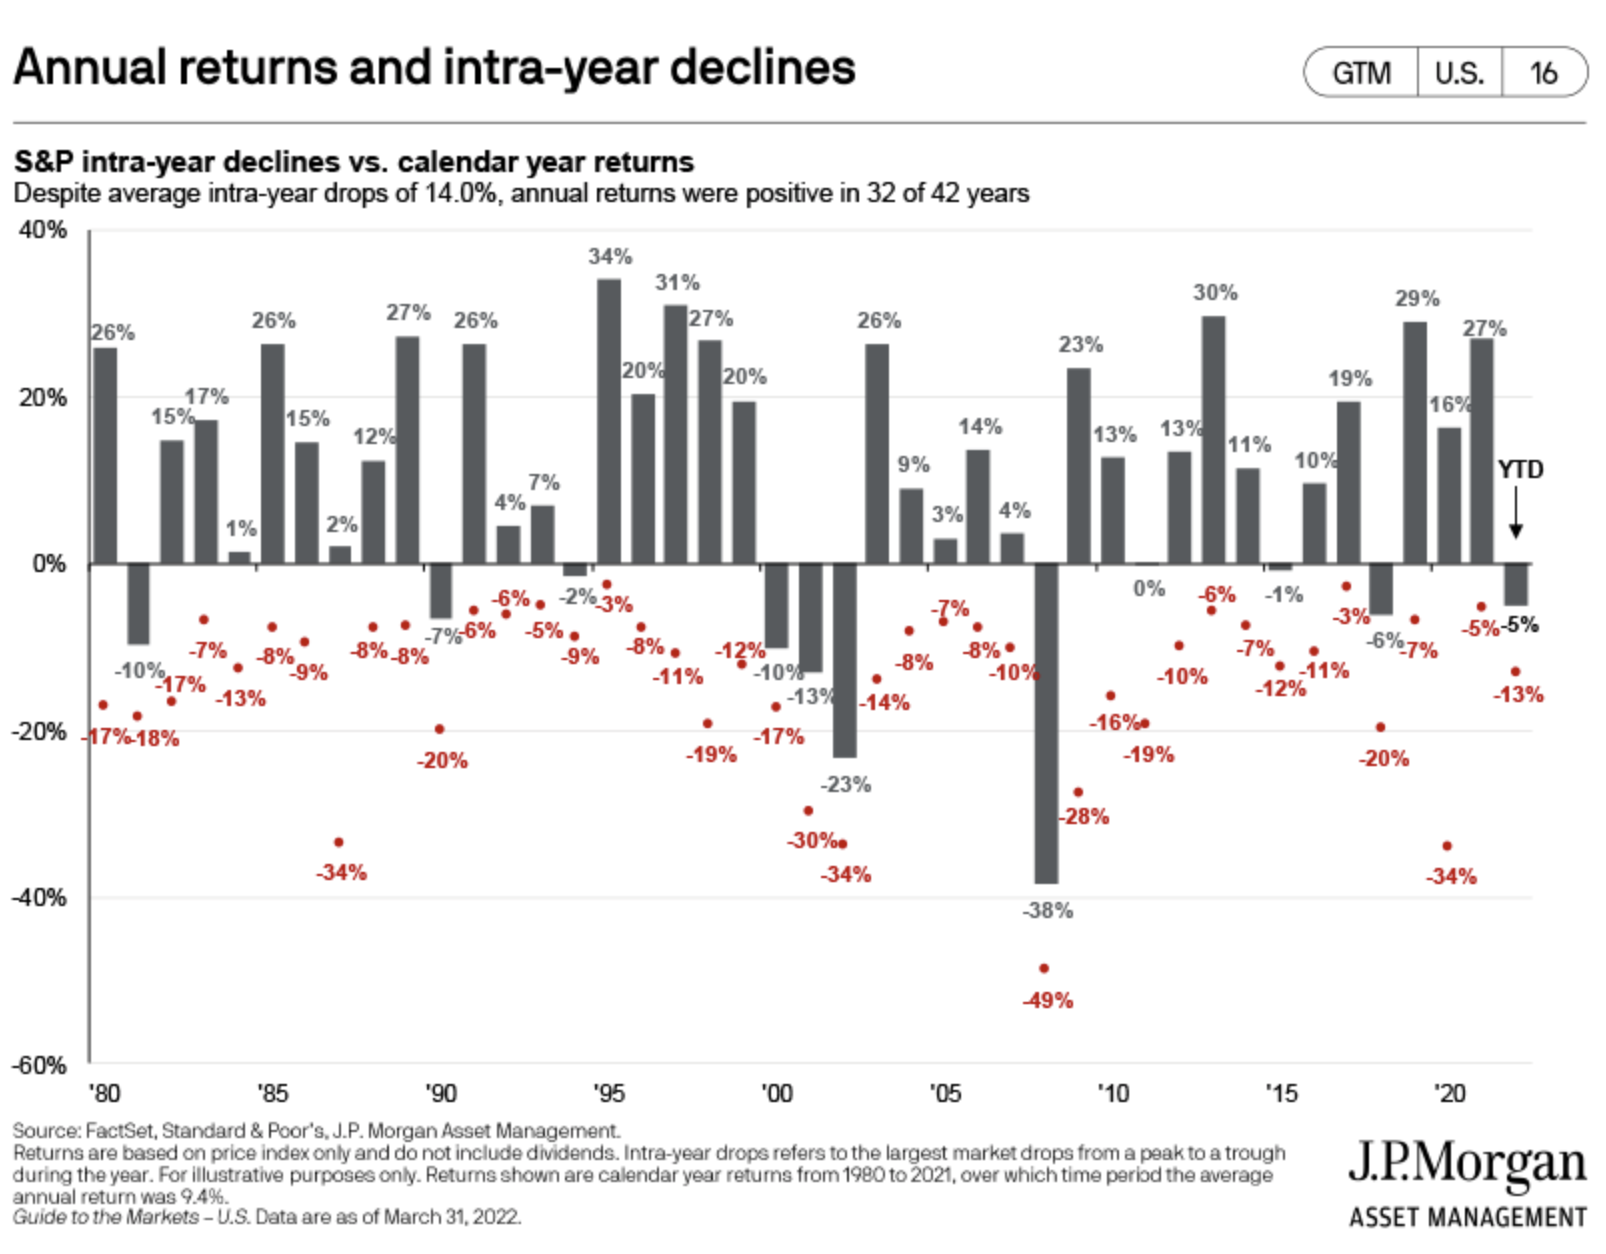
This is one of my favorite slides in the Q2 2022 market guide. Over the last forty years, the market averages a 14% intra-year decline. You have to expect annual double digit corrections every year as a stock market investor and learn not to overreact to them.
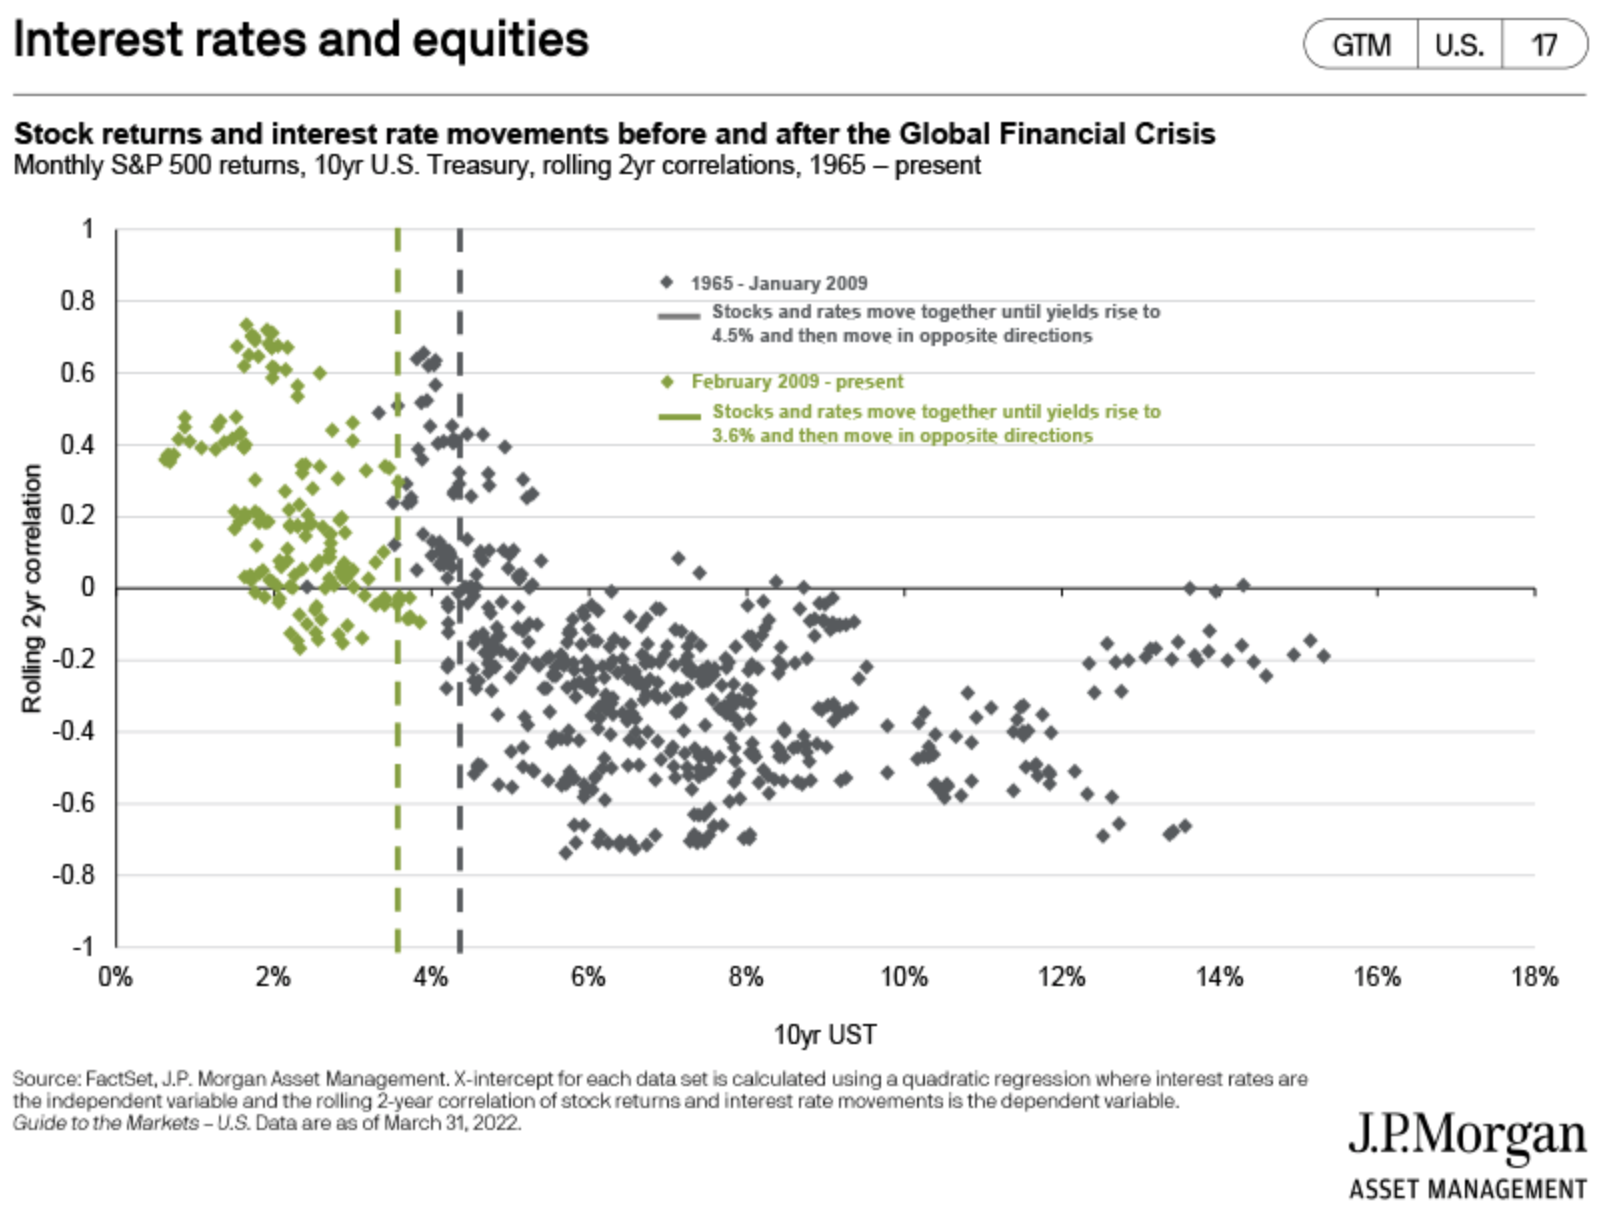
Stocks can do well during rising rate environments, and have, up to a point…
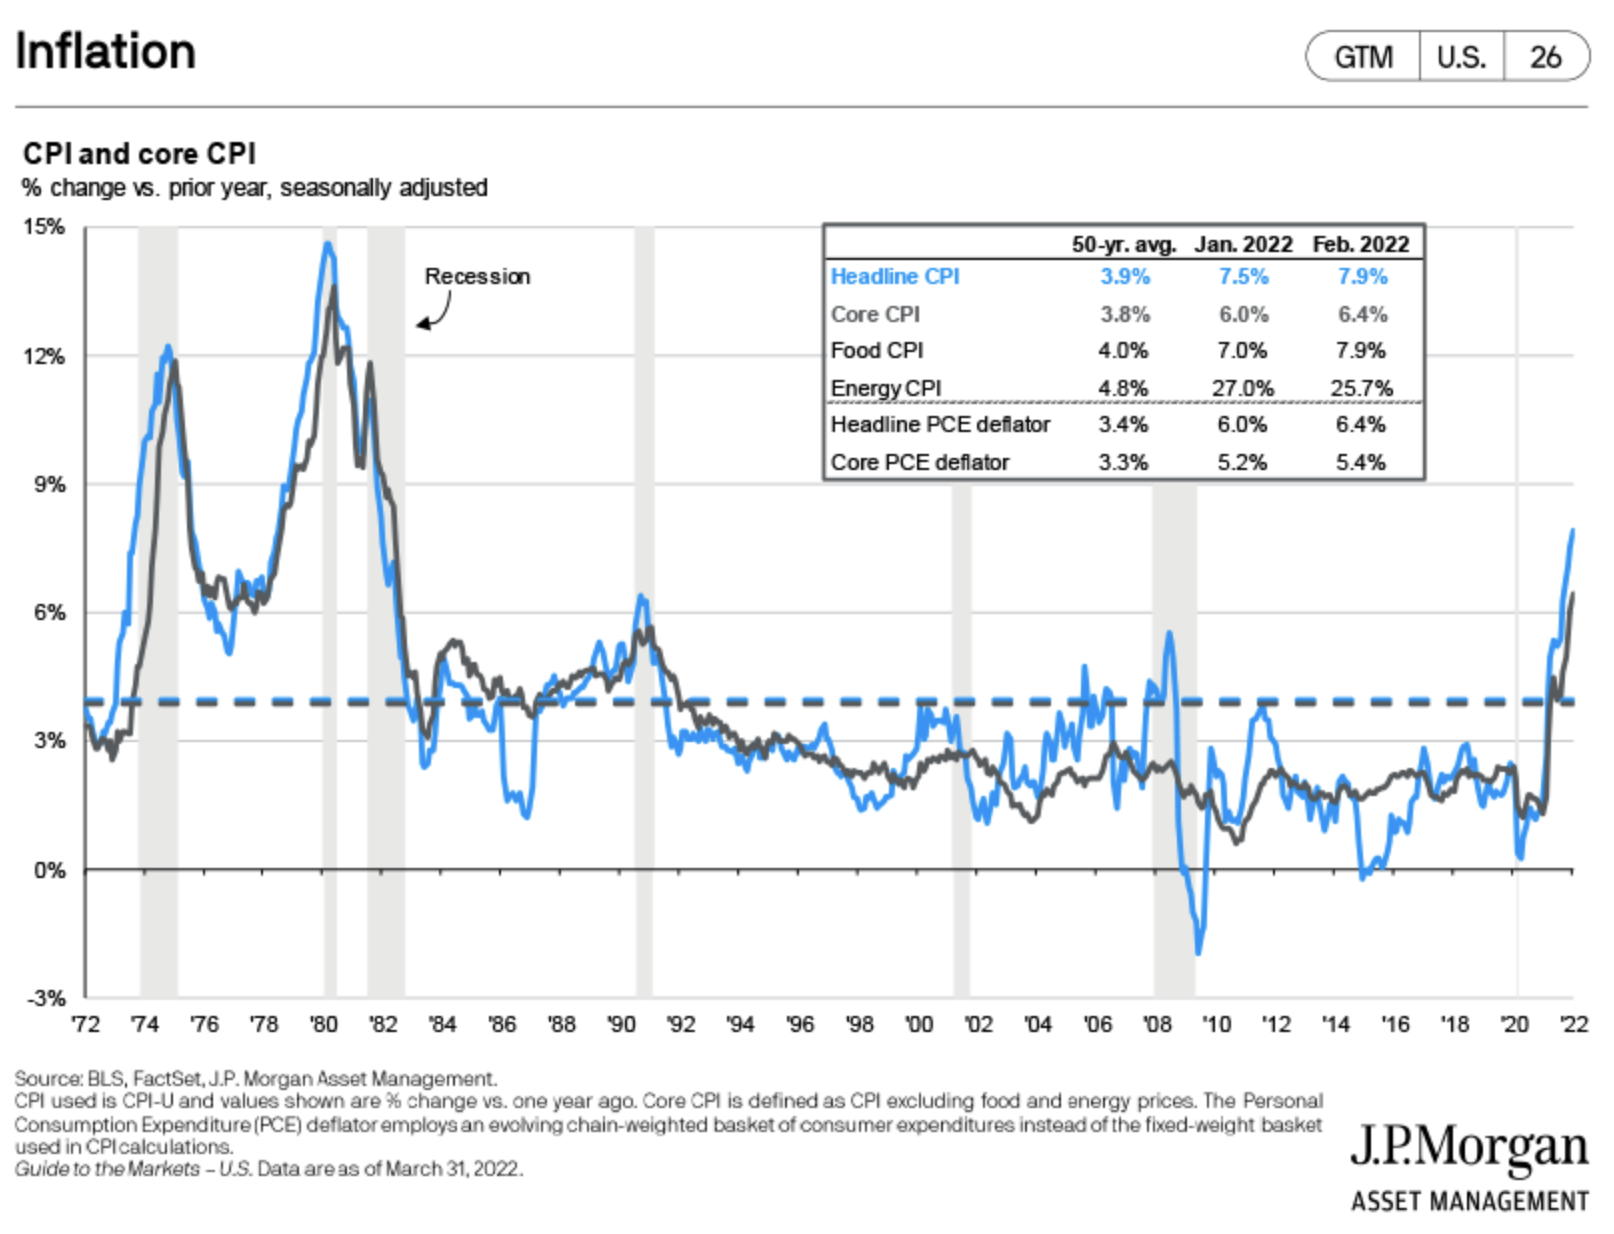
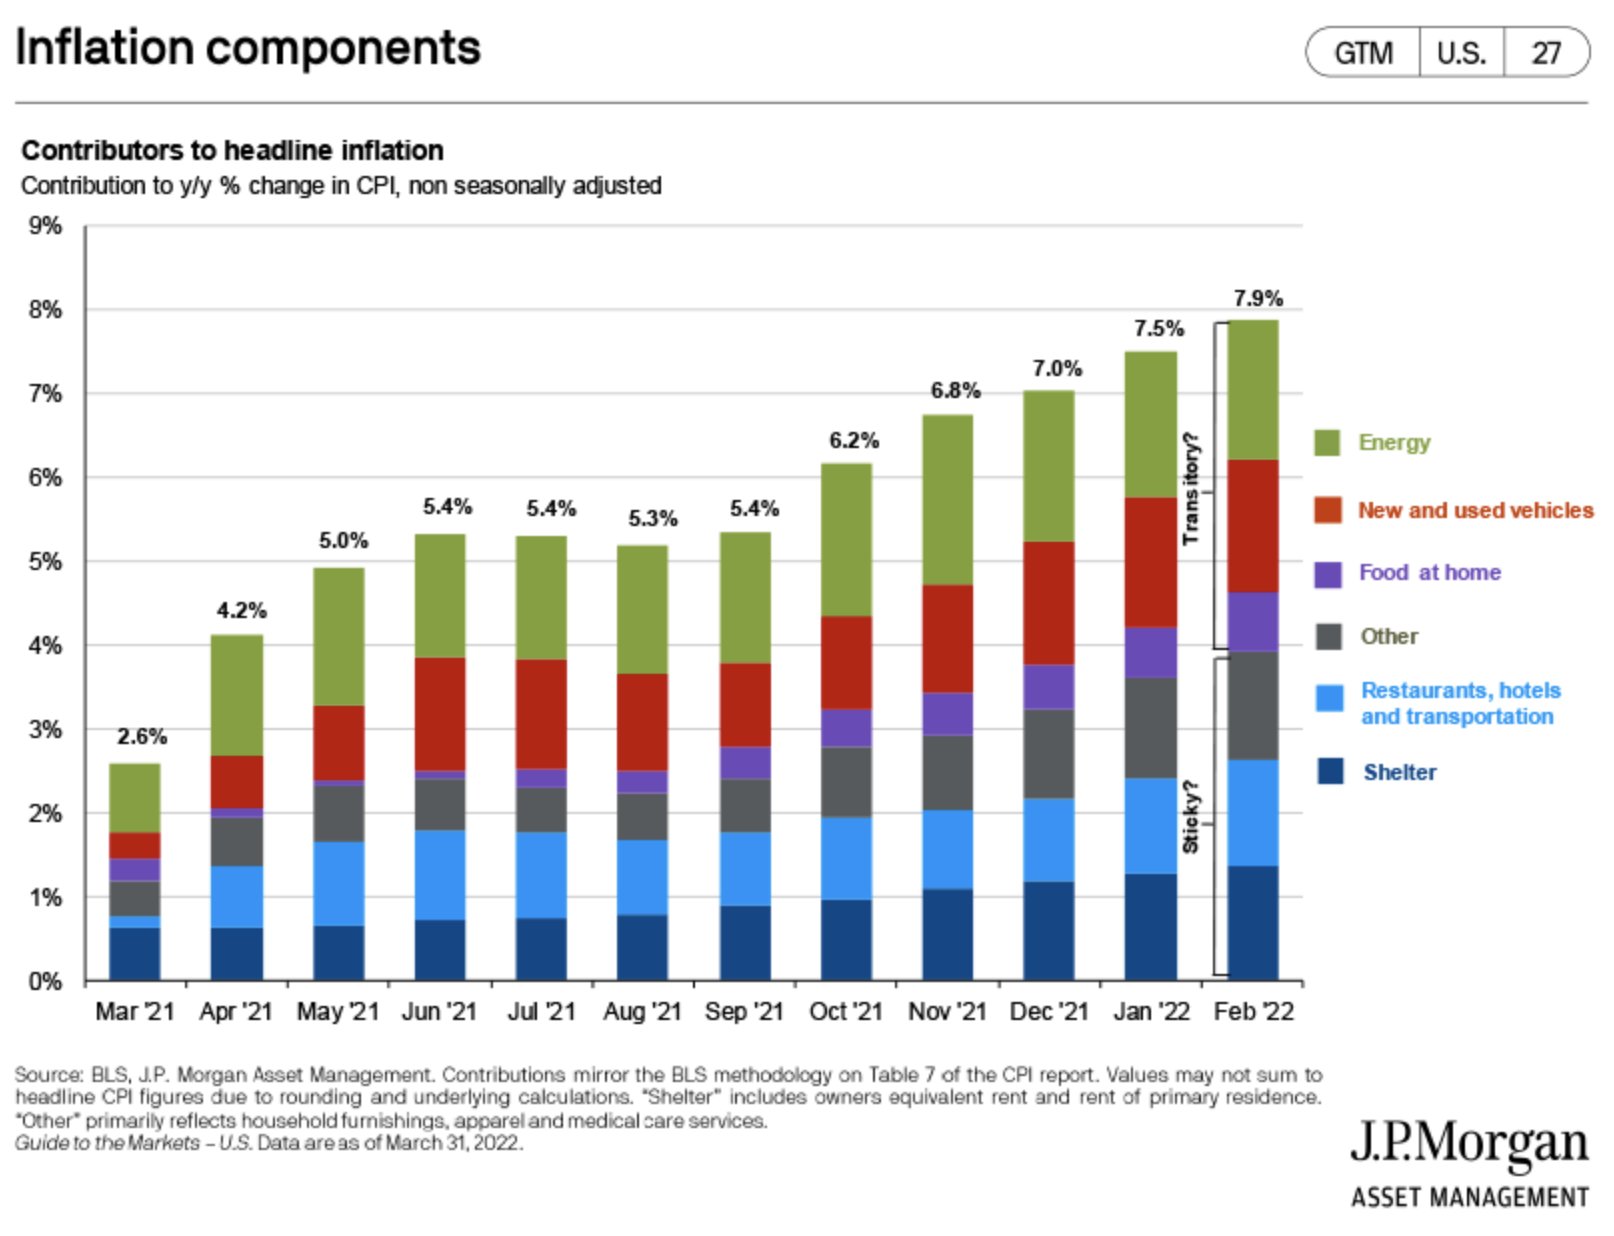
Two inflation charts. The first showing current and historic rates of inflation, the second showing what’s contributing to headline inflation recently.
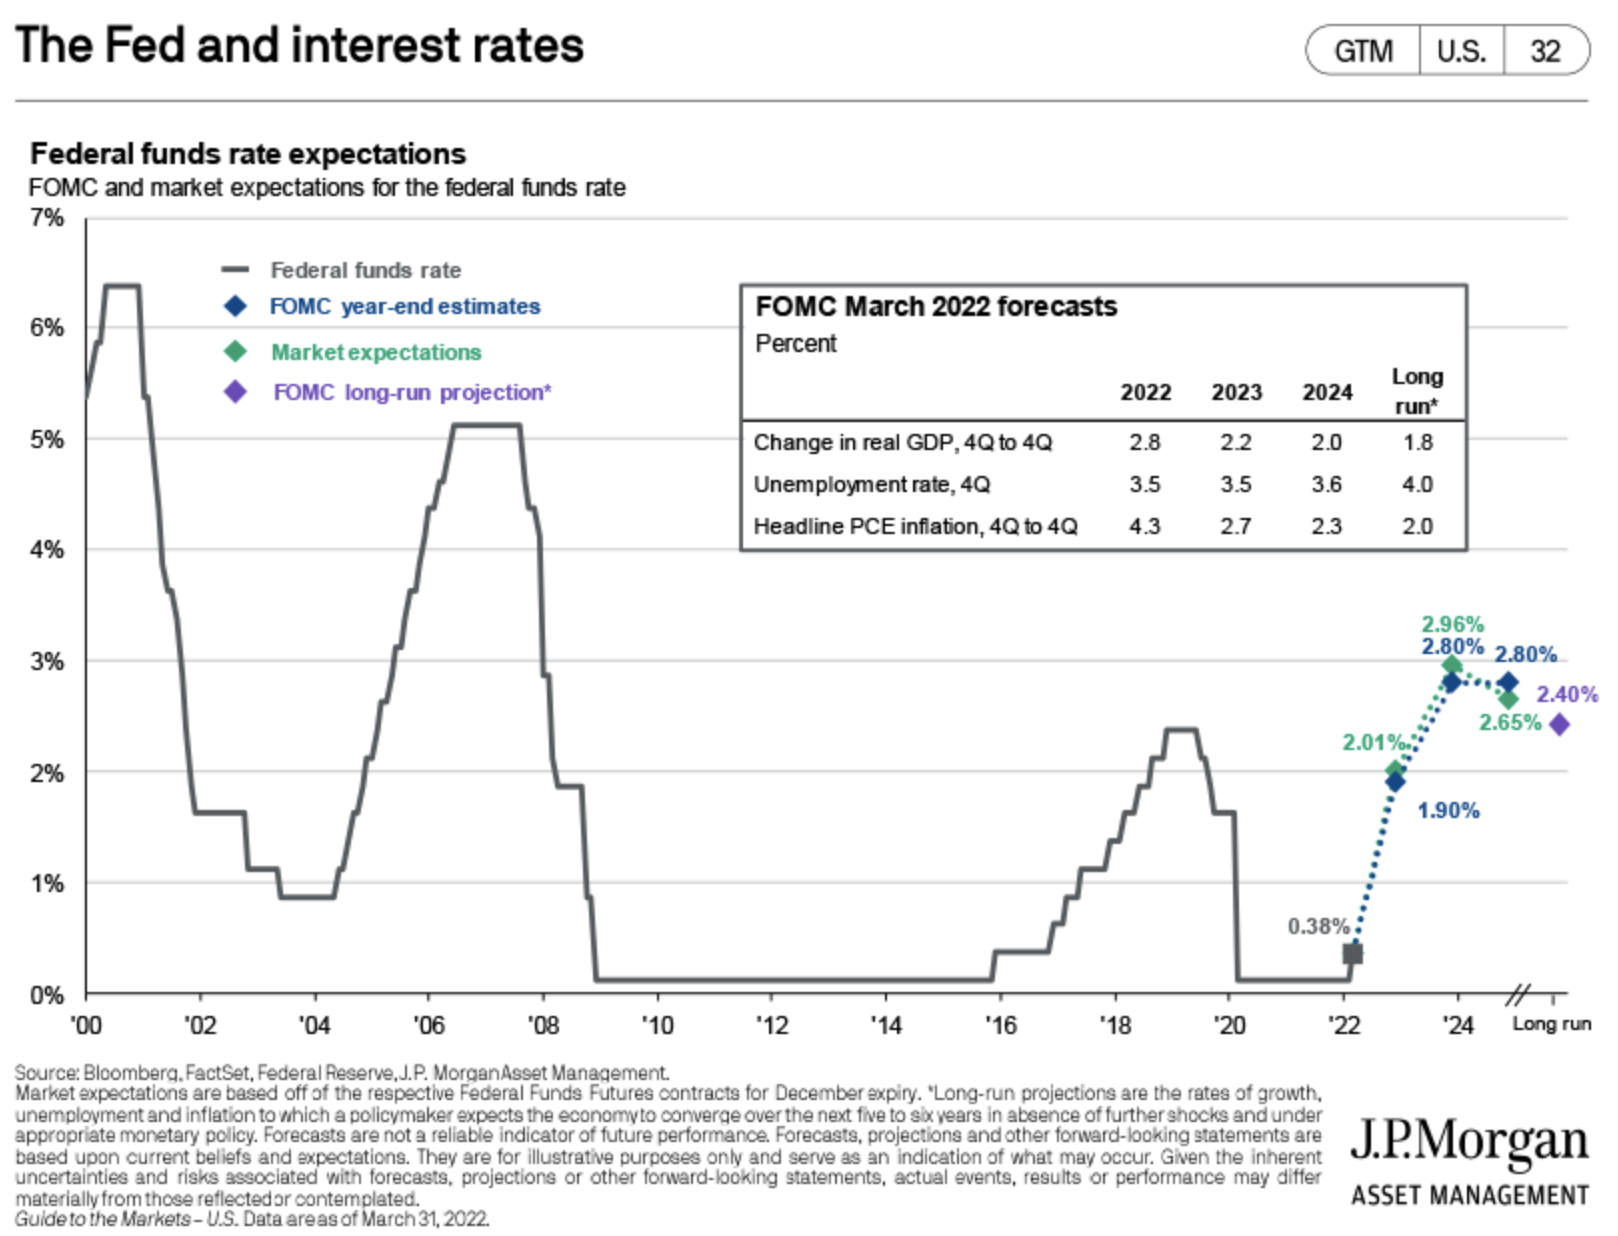
Outlook for interest rates rising over the next few years.
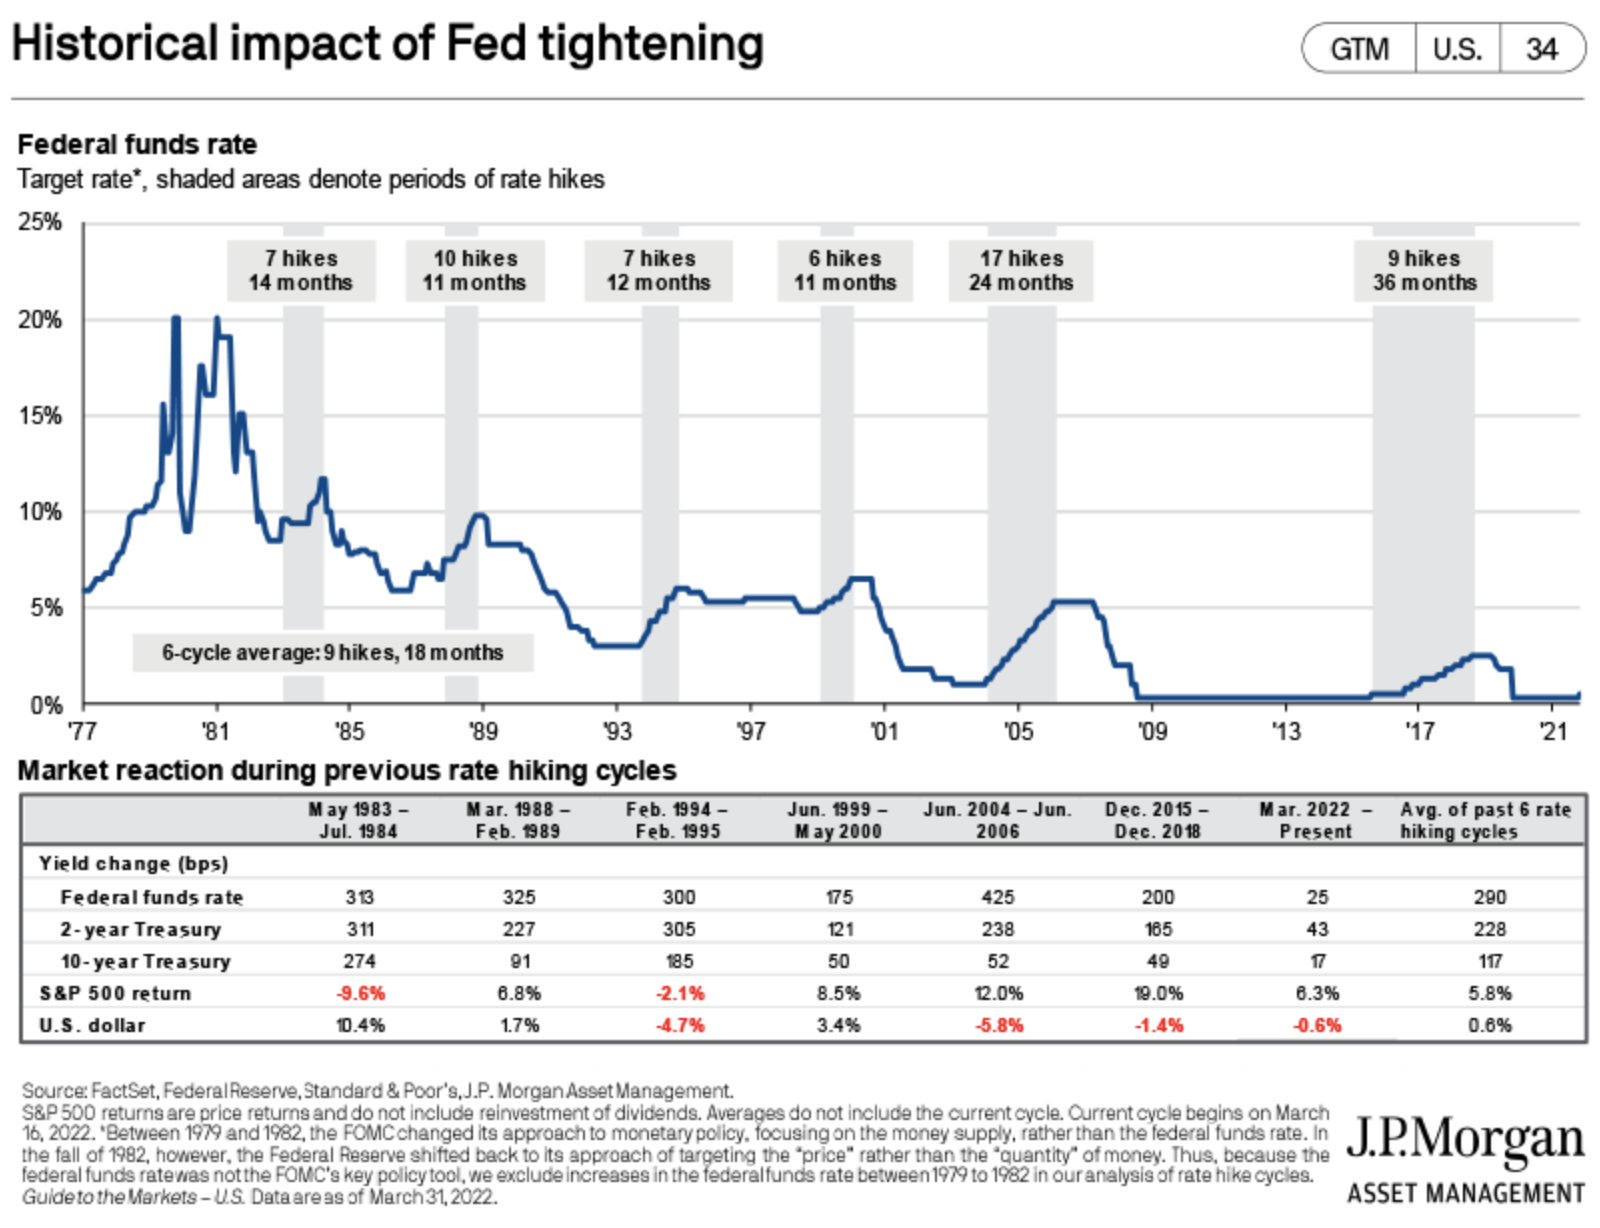
The market has performed well during previous interest rate hike cycles, with positive numbers during two of the last six.
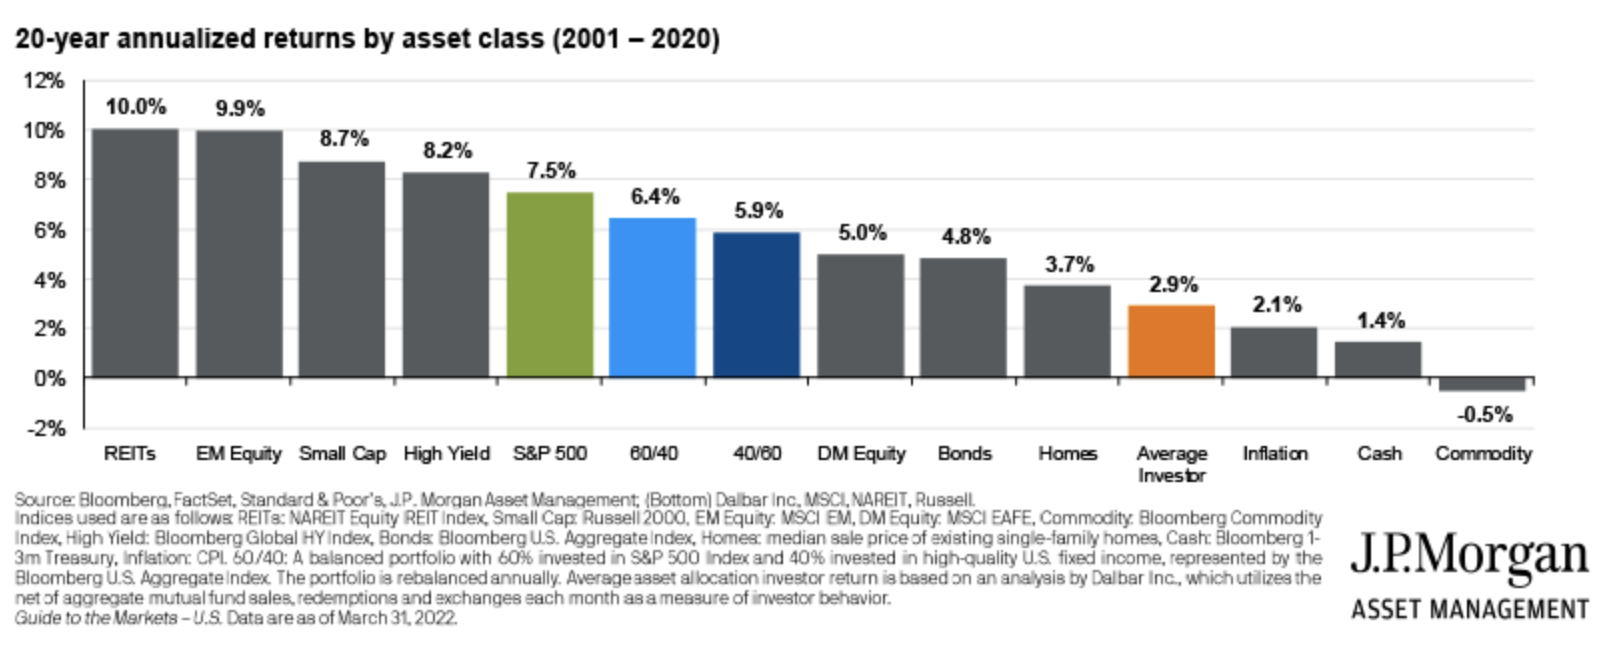
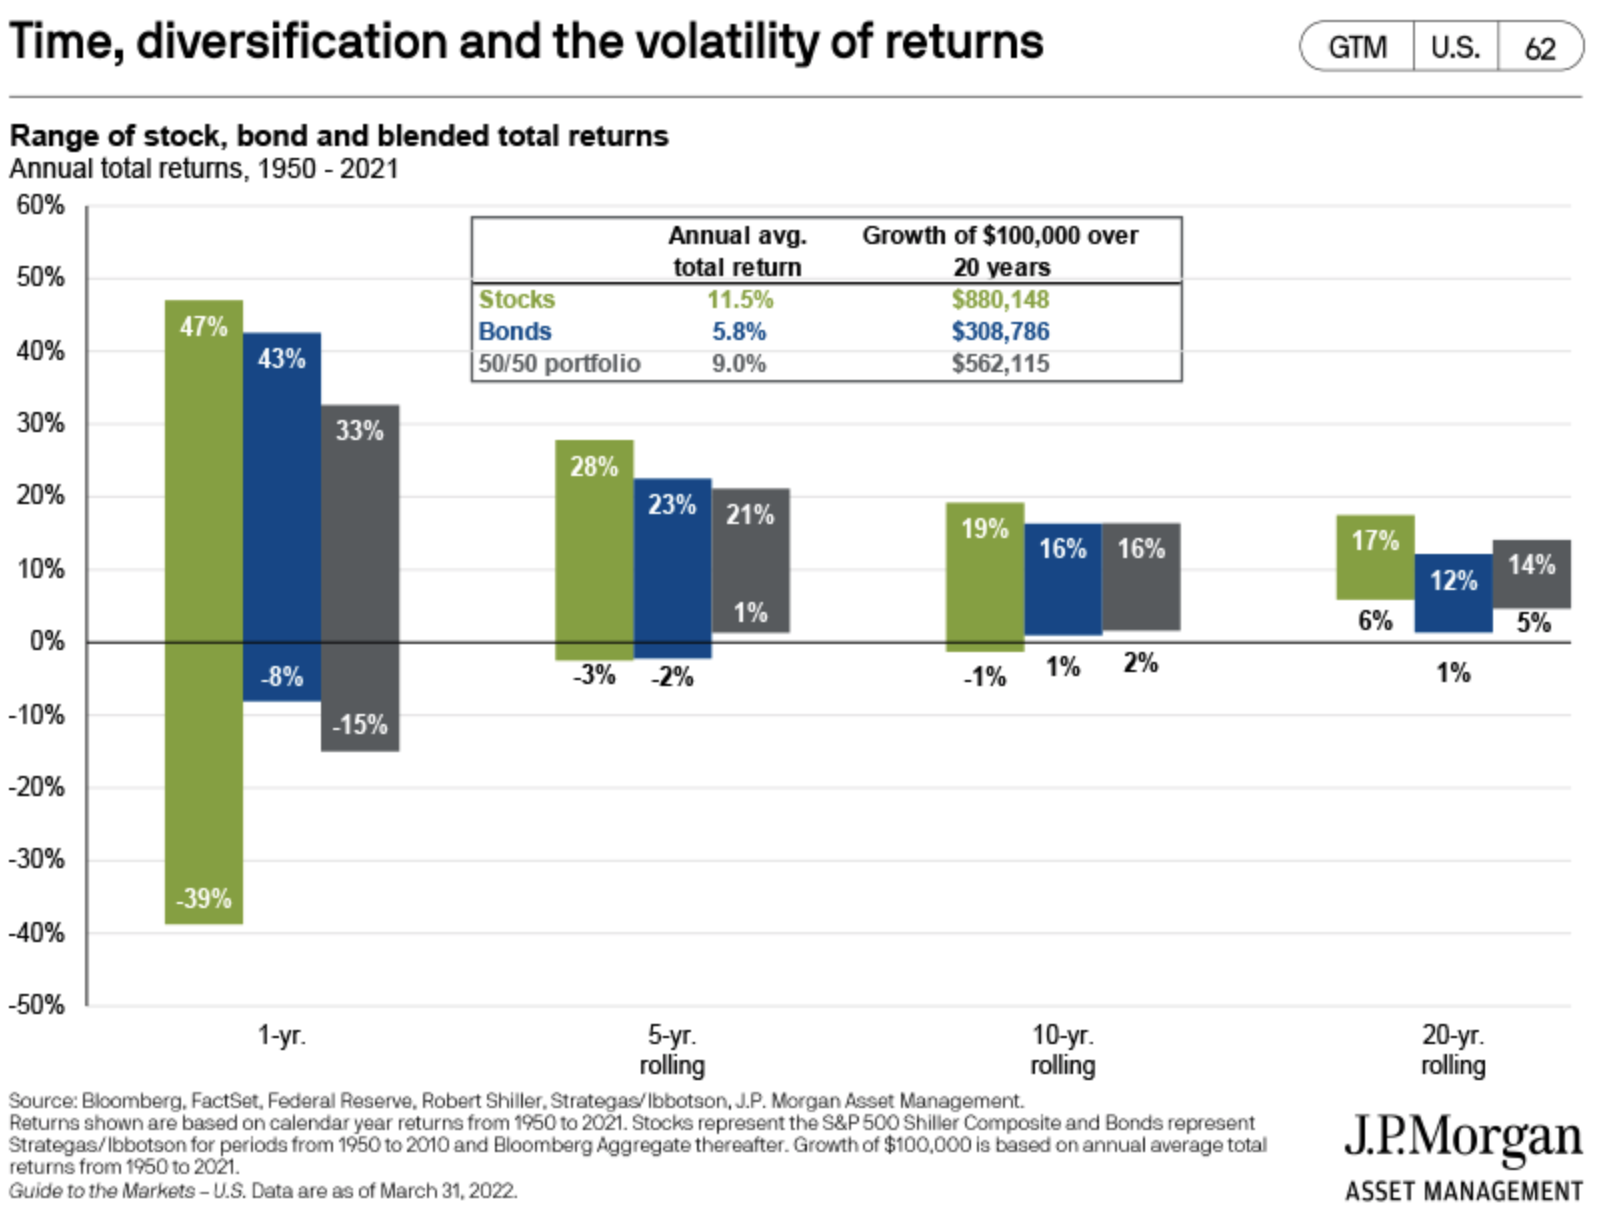
Another favorite. Don’t let short-term volatility shake you out of earning the market’s long-term returns.
Patience continued…the average investor underperforms almost every type of investment by poor timing decisions and chasing winners.