Before getting into our Q3 2022 market guide, let’s take a quick look at the tough start to the year for the markets:
- Stocks entered a bear market
- Bonds are on pace for their worst year ever
- Speculative excess is getting wrung out
- Inflation remains high, and recession concerns dominate
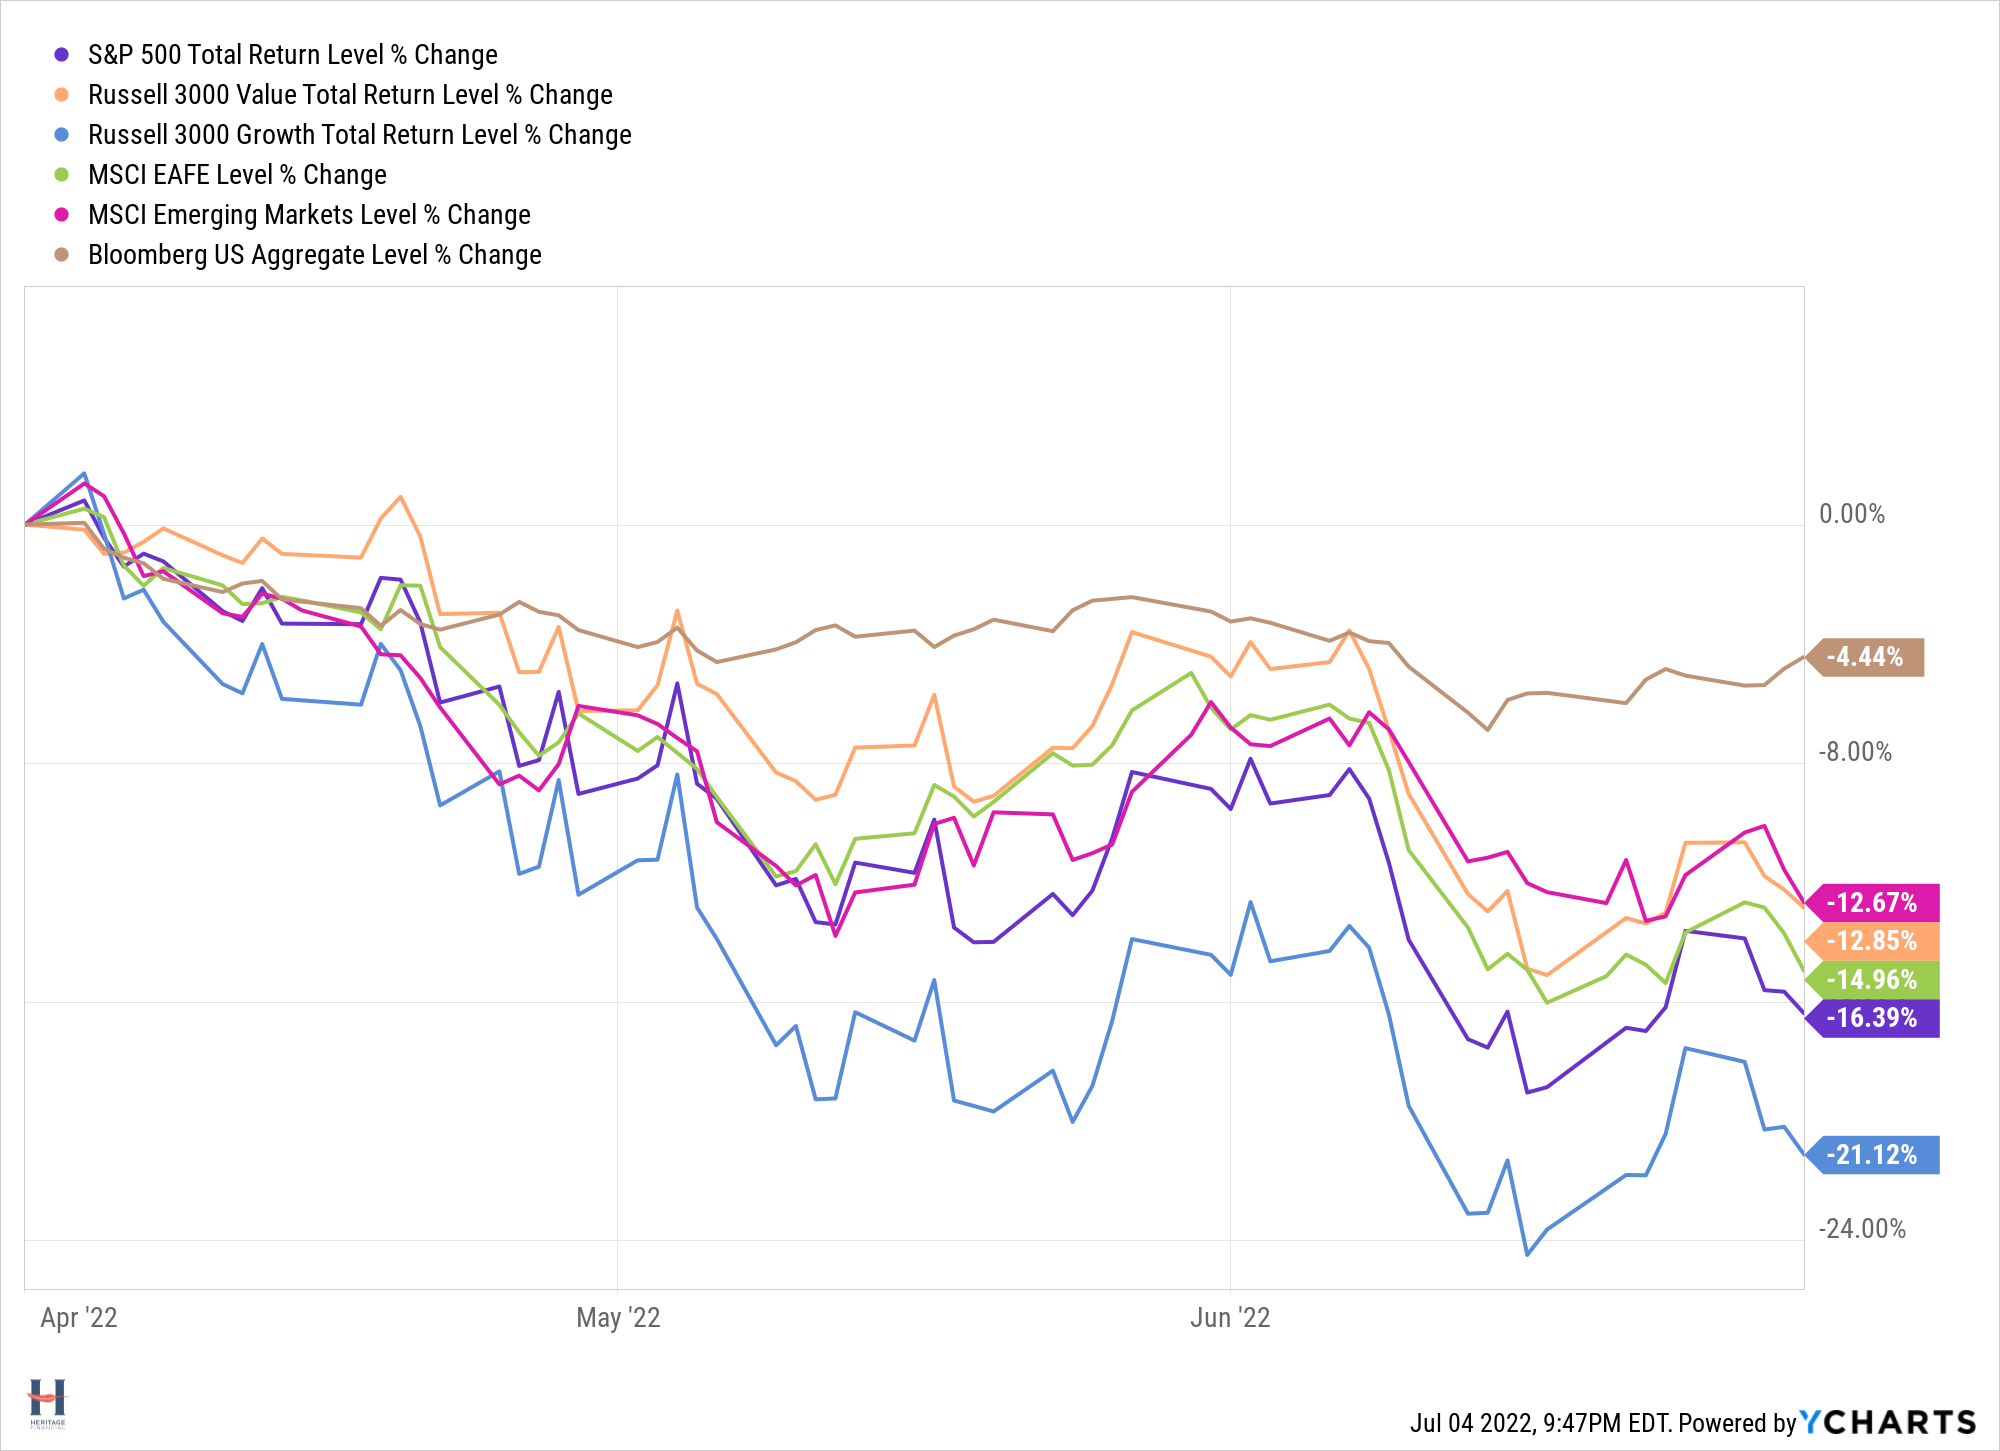
In the second quarter, the S&P 500 was down 16.39%. U.S. growth stocks were down more (21.12%), and U.S. value stocks were down less (12.85%). Developed International stocks were down less than the S&P 500 (14.96%), and Emerging Markets were down even less (12.67%). U.S. bonds were down 4.44%.
To take a deeper dive into the quarter that was and where we may go from here, here are some of the Q3 2022 market guide charts that stood out to me from J.P. Morgan Asset Management’s Guide to the Markets slide deck.
The Charts
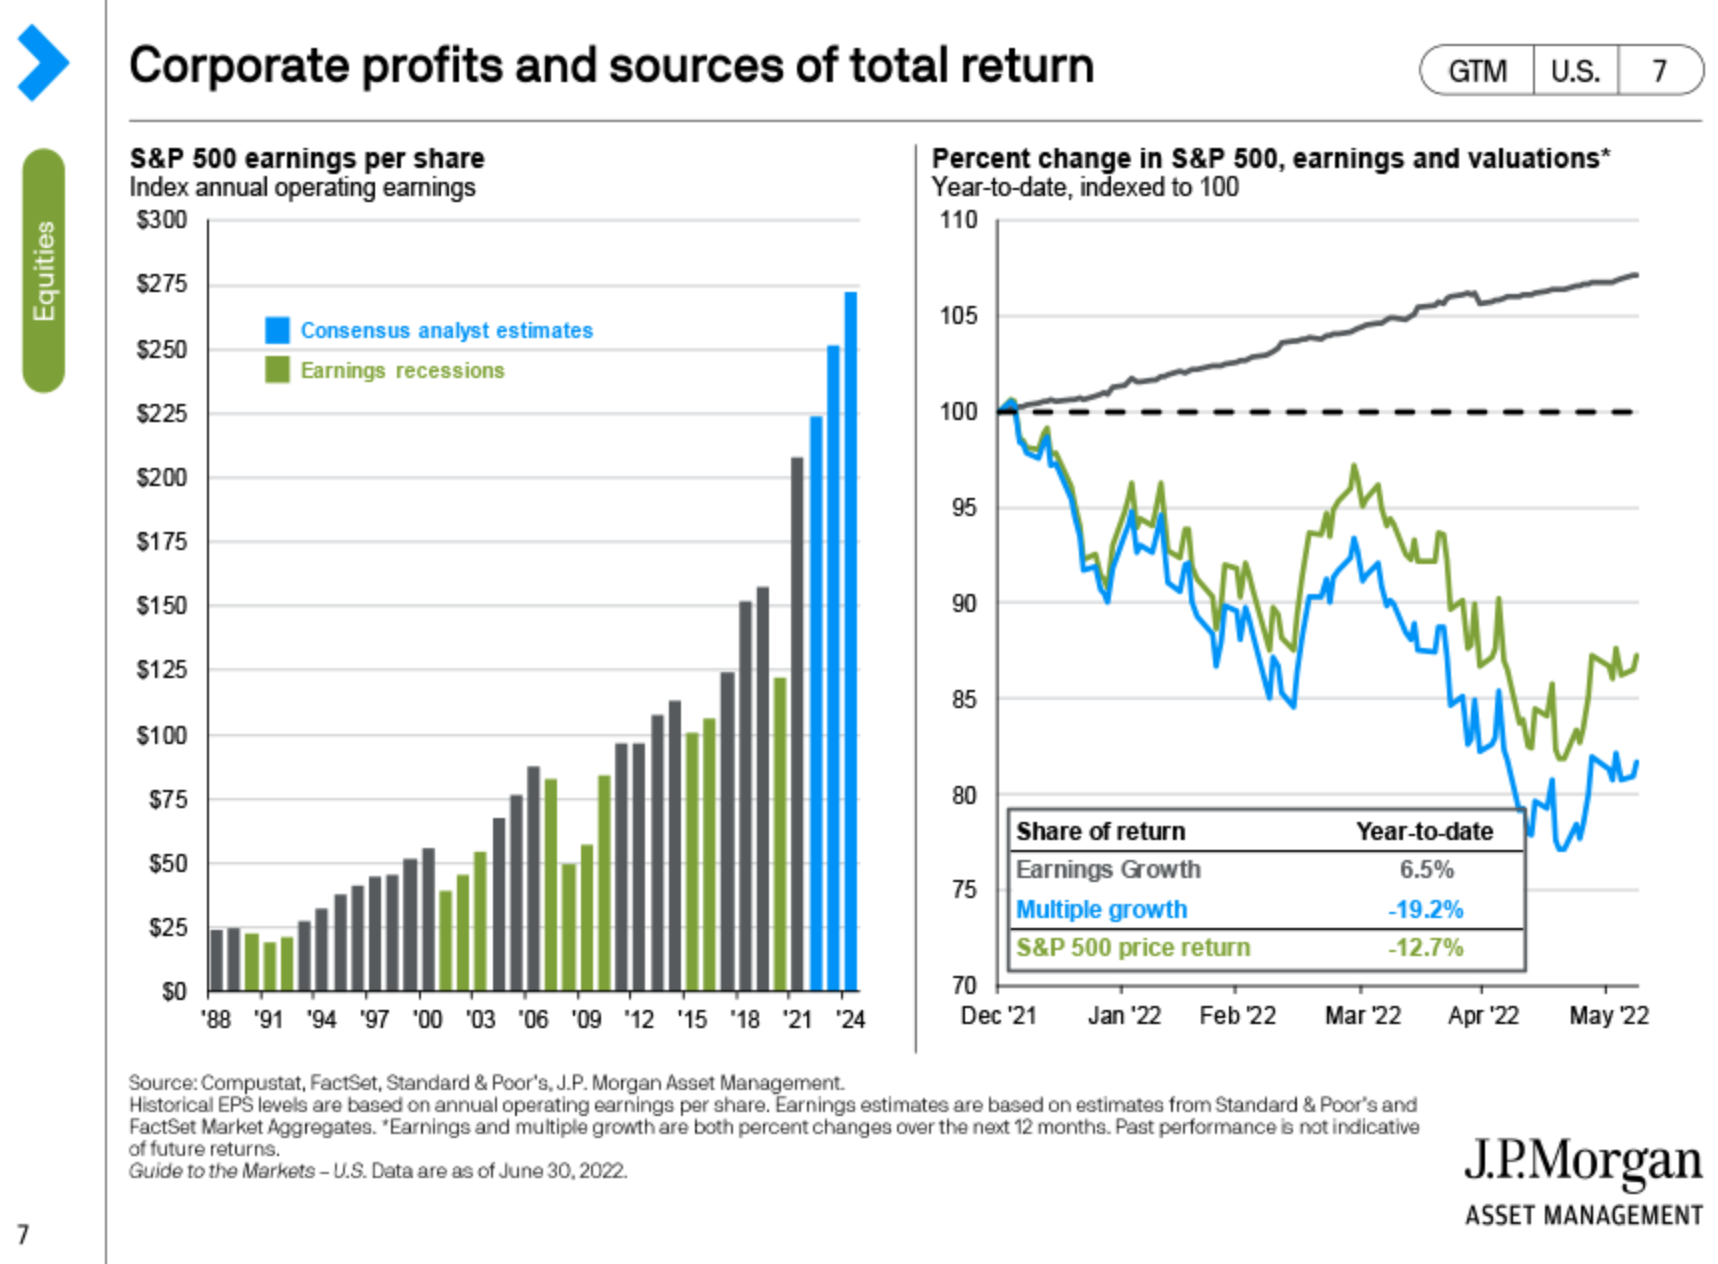
The chart on the right shows that while corporate earnings have continued to grow the market sell-off is being driven by investors wanting to pay less of a multiple for those earnings.
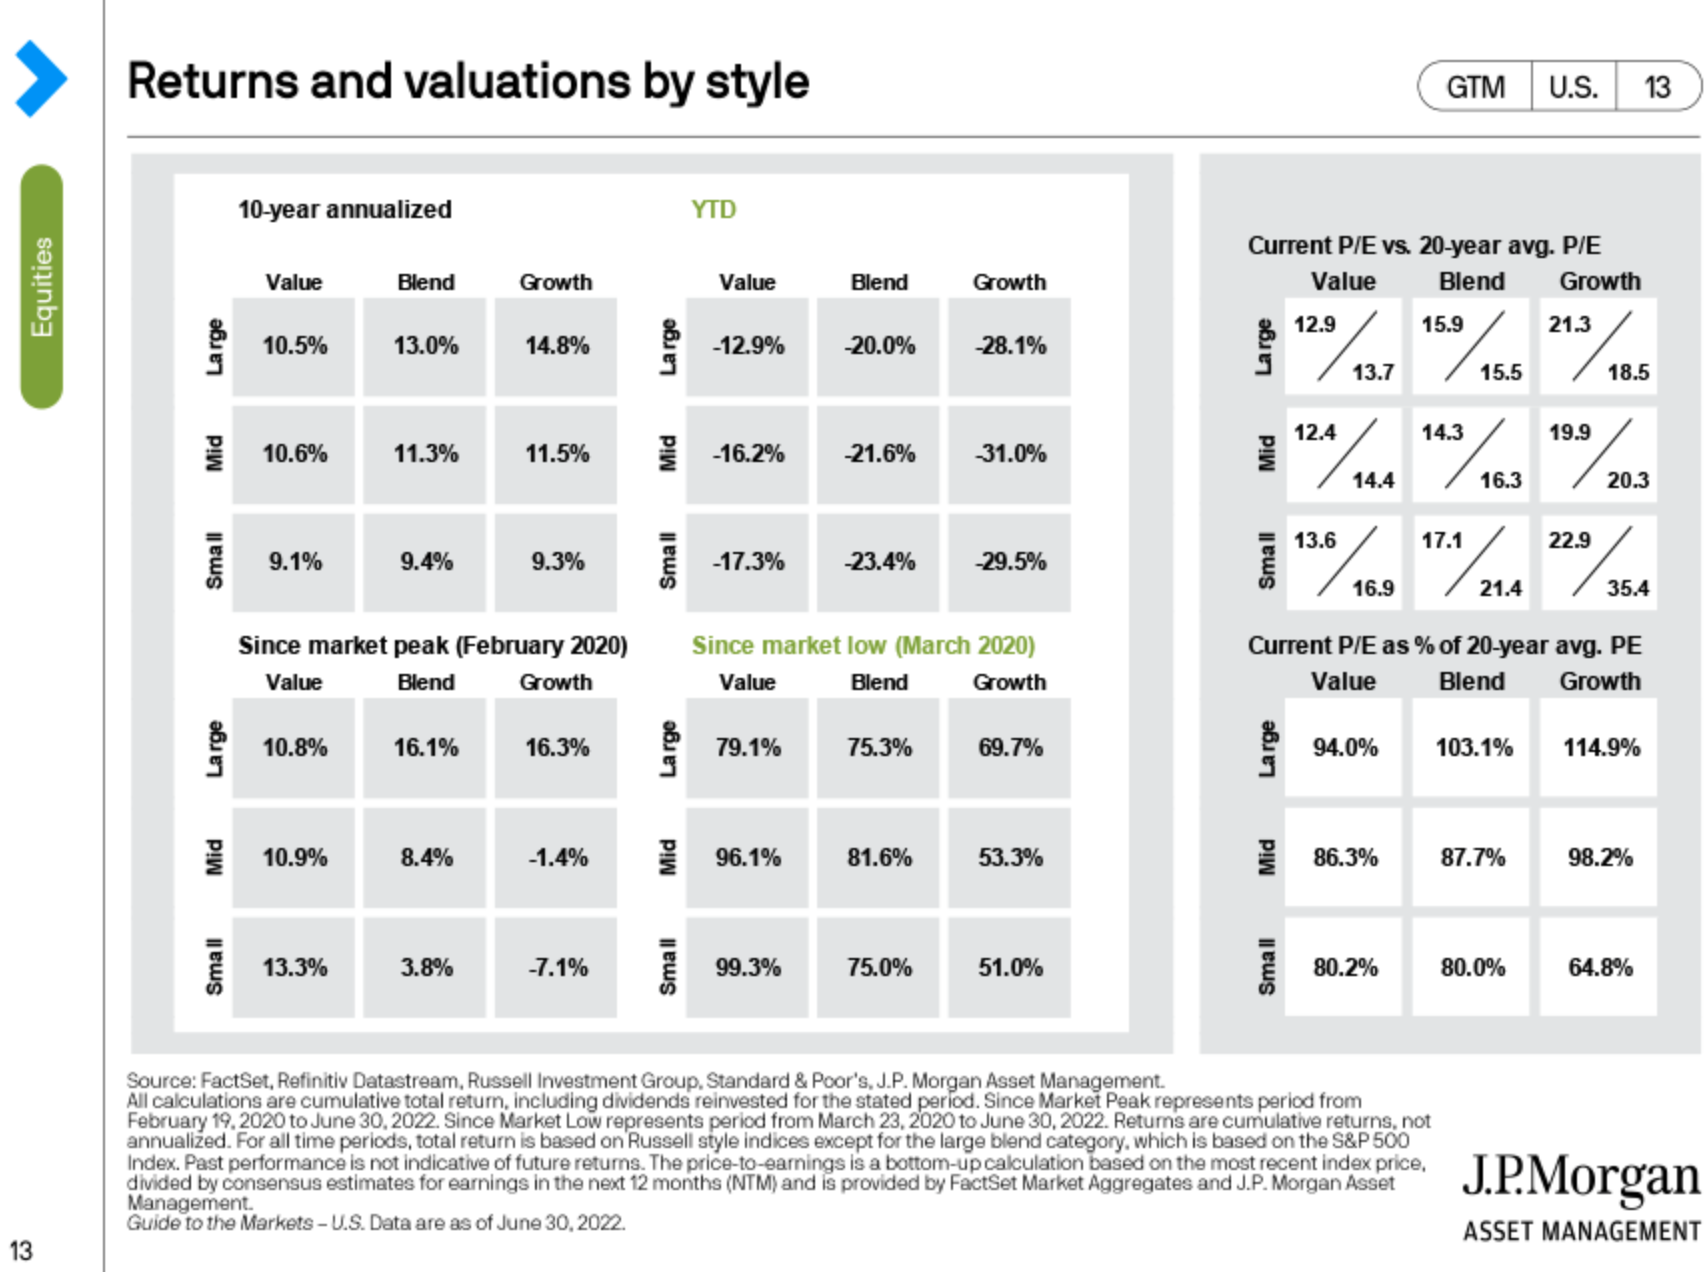
The Value vs. Growth story on one page. Growth’s long-term outperformance versus value has turned into more recent underperformance. Since the market bottom in 2020, value has sharply outperformed and is relatively attractive going forward.
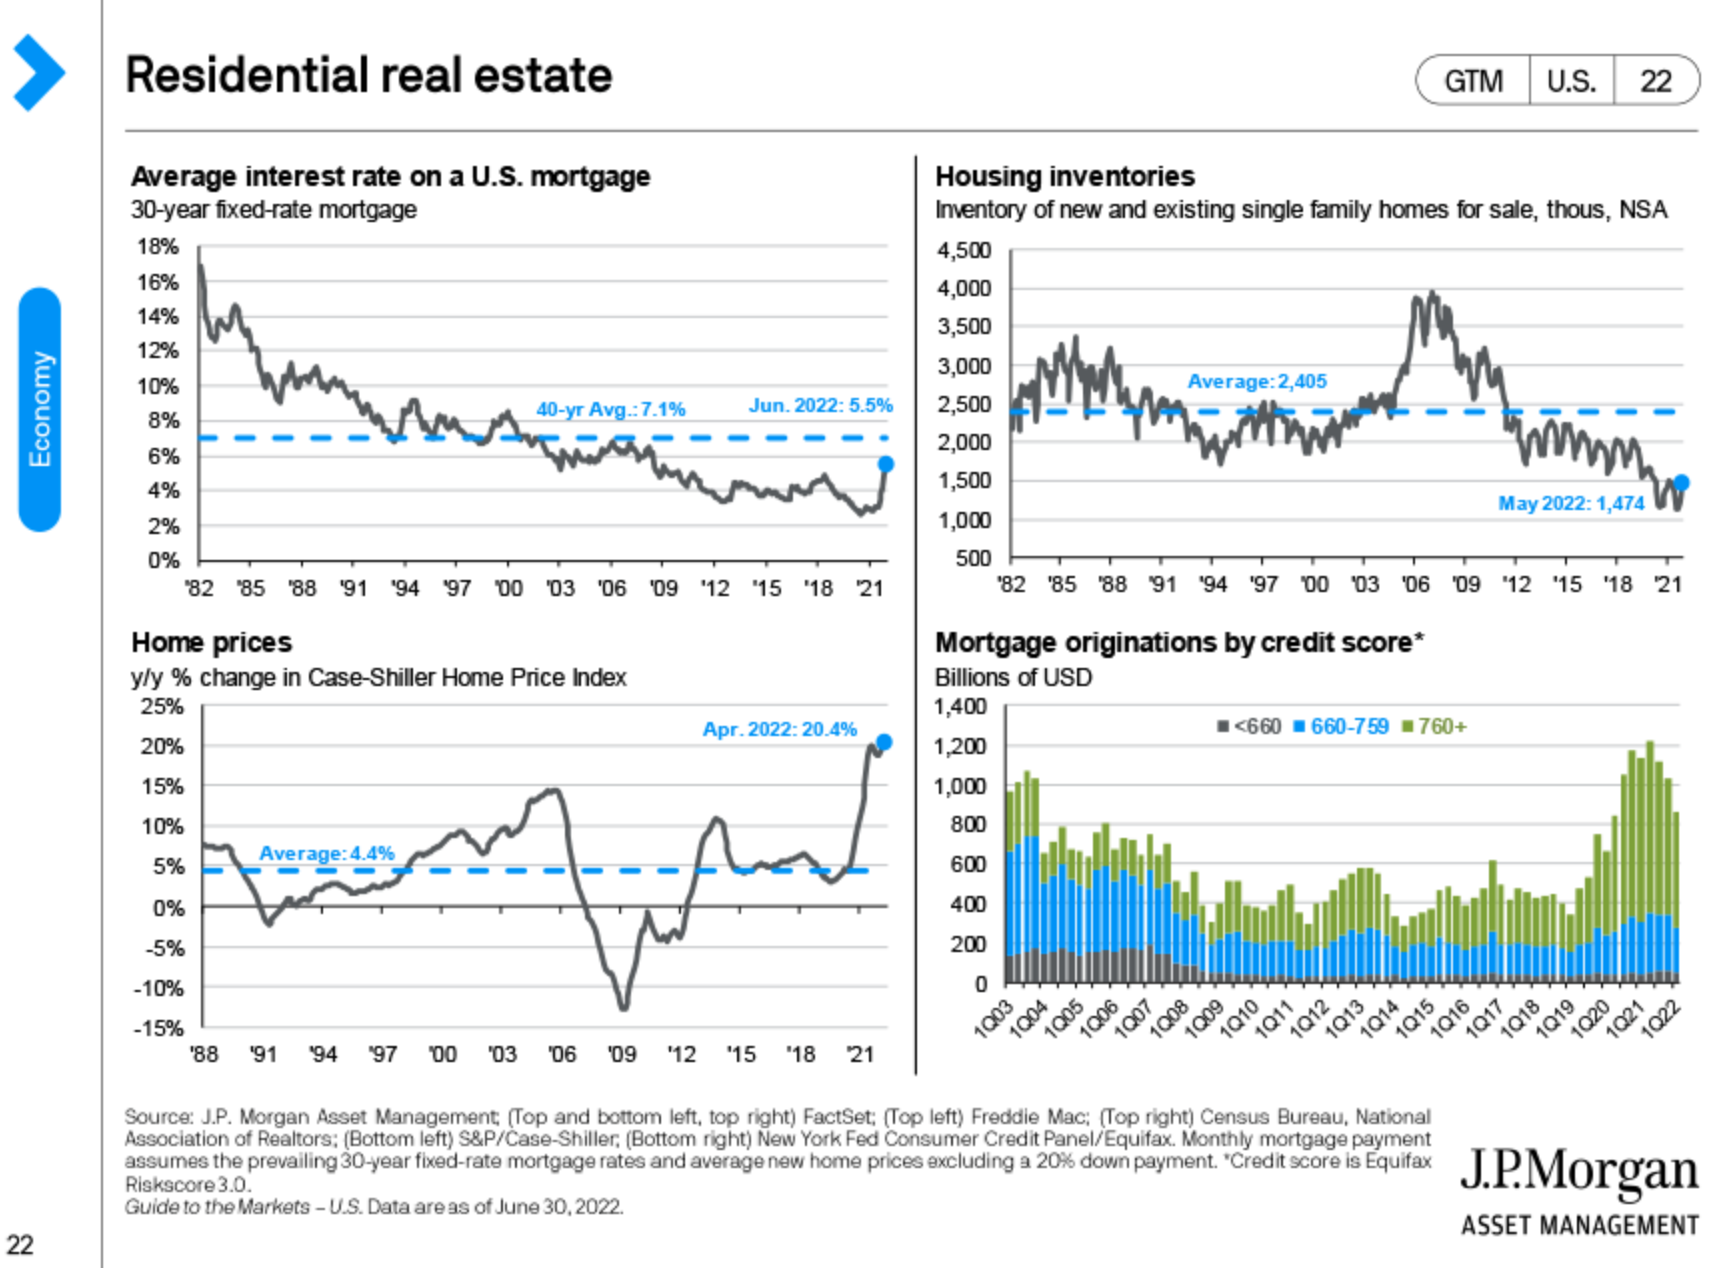
Some real estate numbers. Mortgage rates are up, but below long-term averages. Home prices have continued to increase with inventories down. The credit ratings of mortgage borrowers has been strong, possibly reducing fears of a real estate crash.
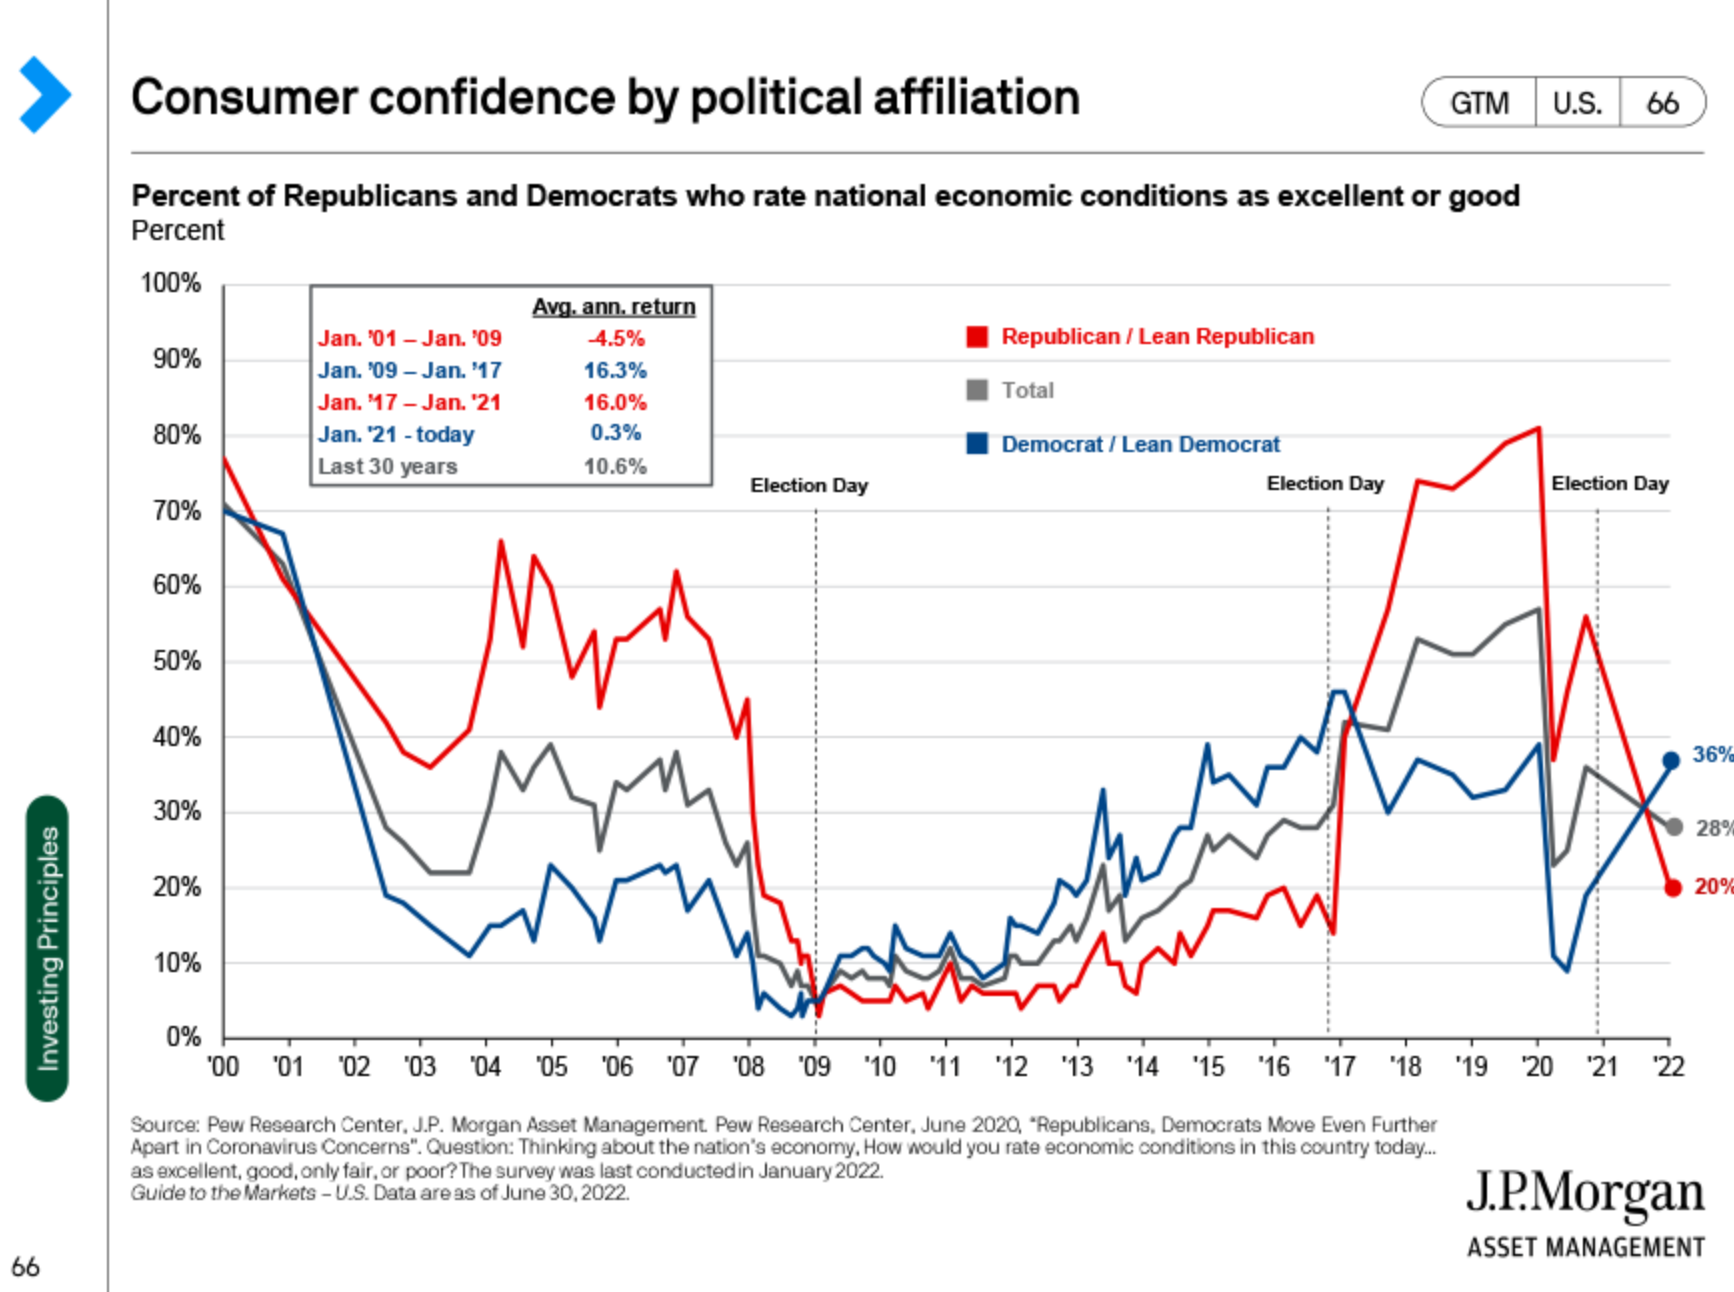
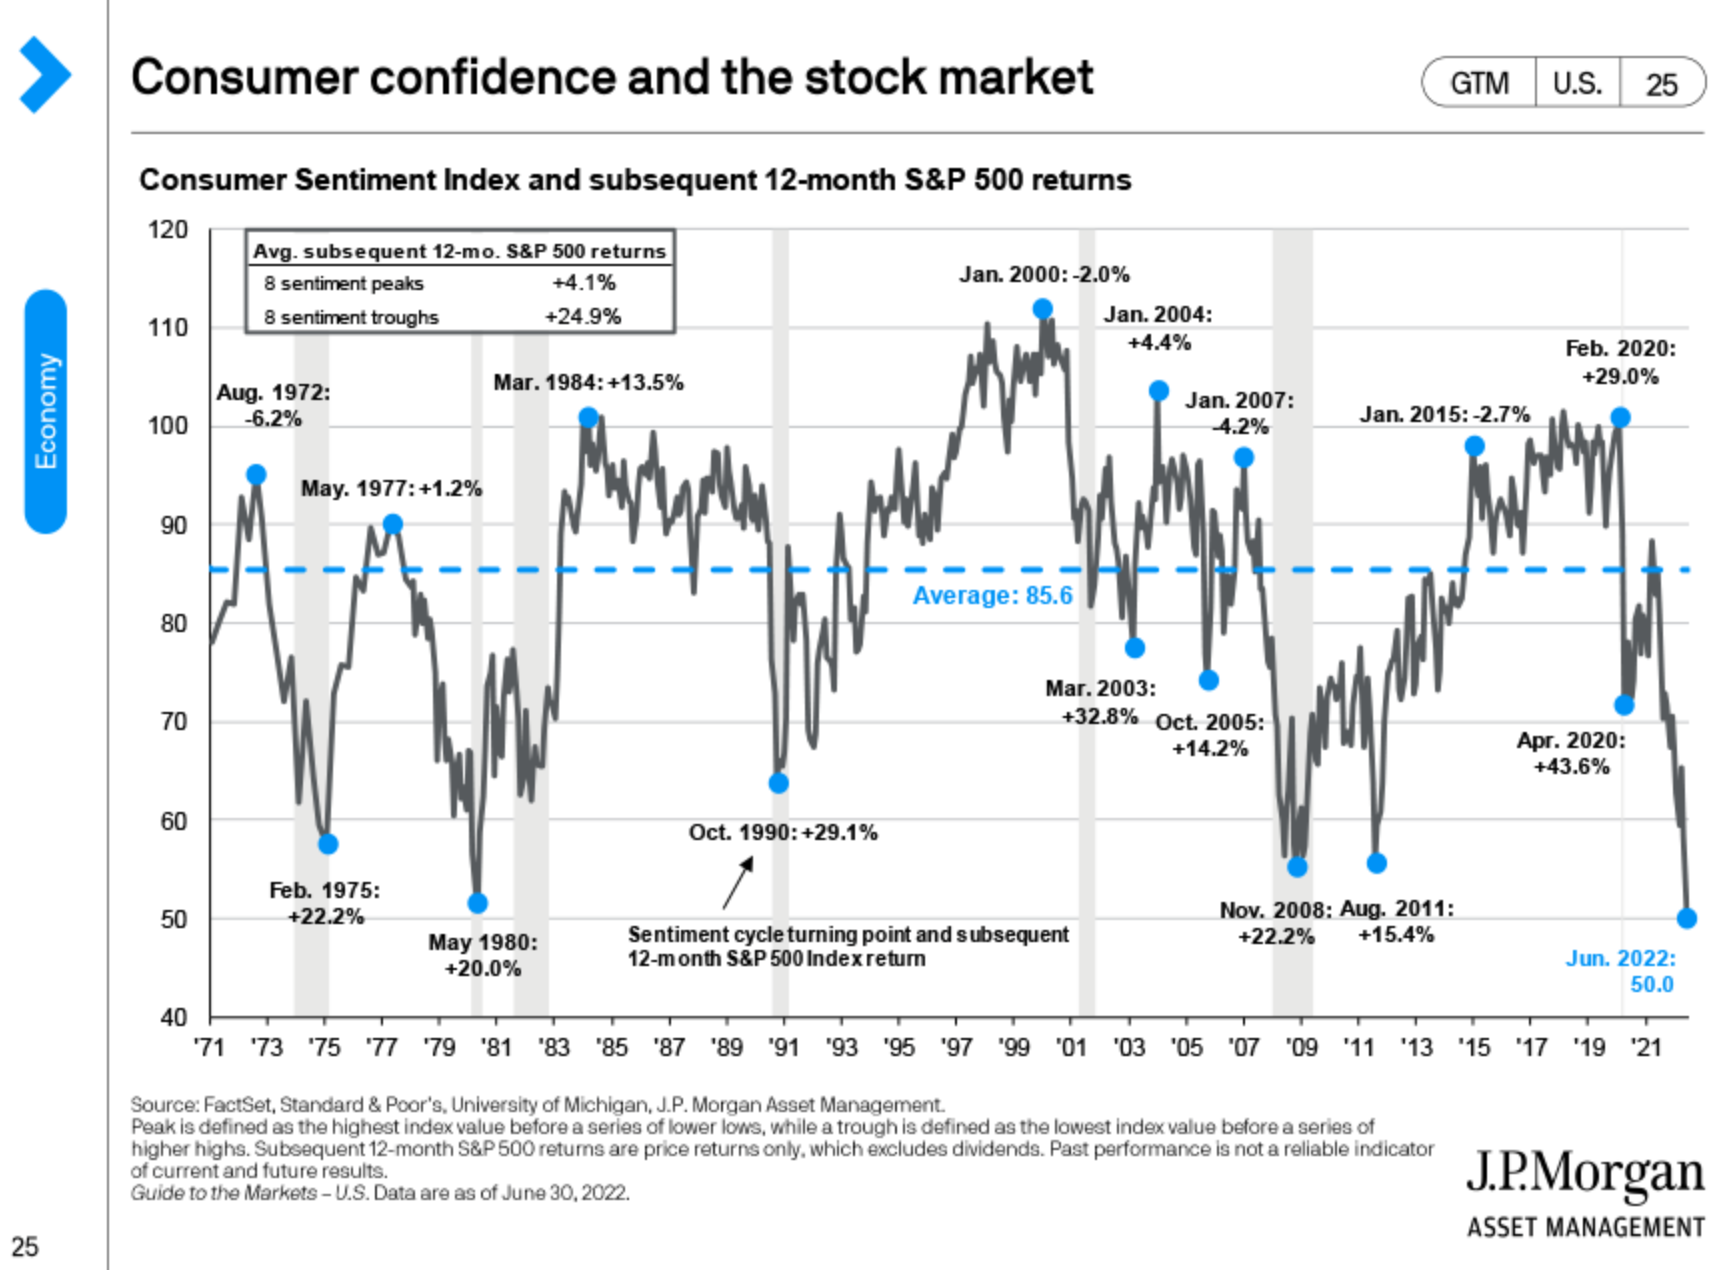
Consumer sentiment is awful, which has historically been a good sign for stocks.
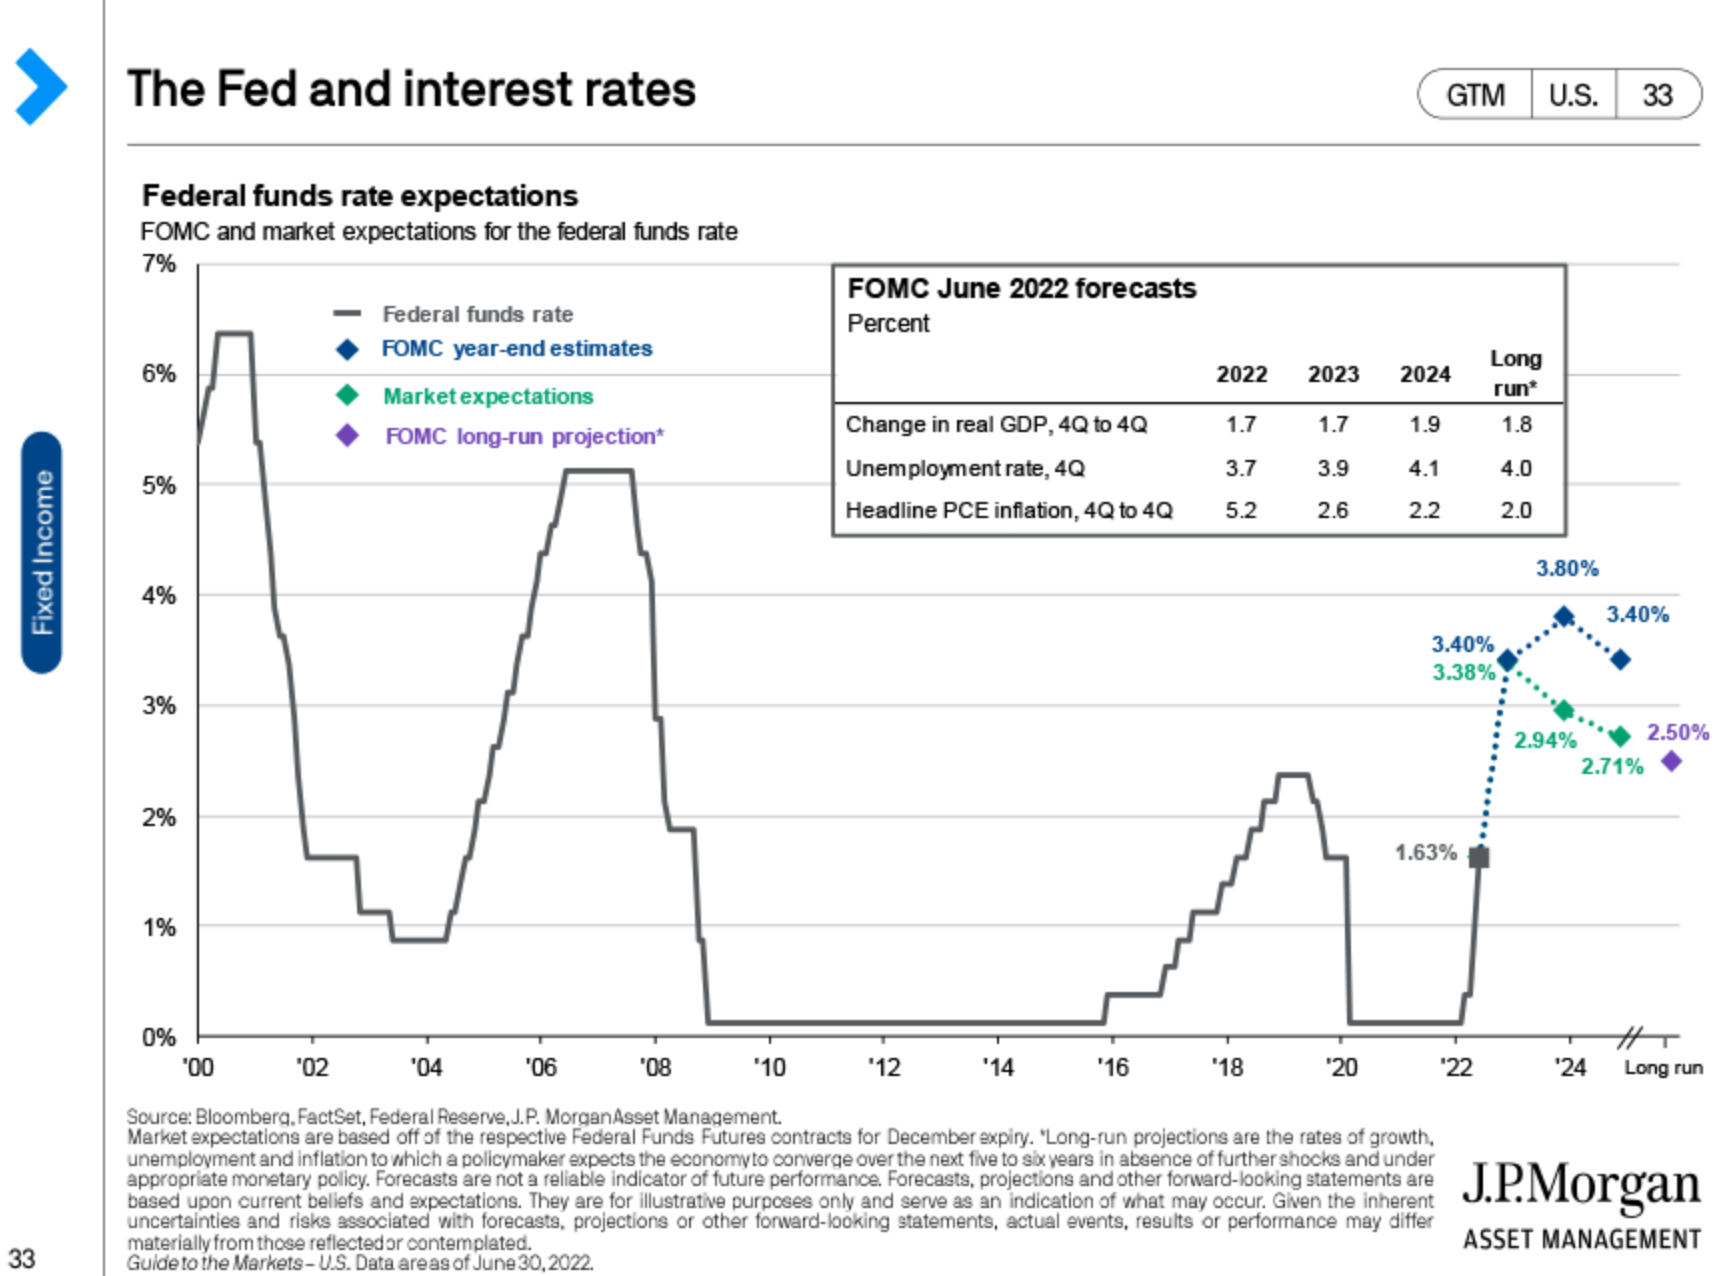
Expectations are now building for rate cuts in the next couple of years.
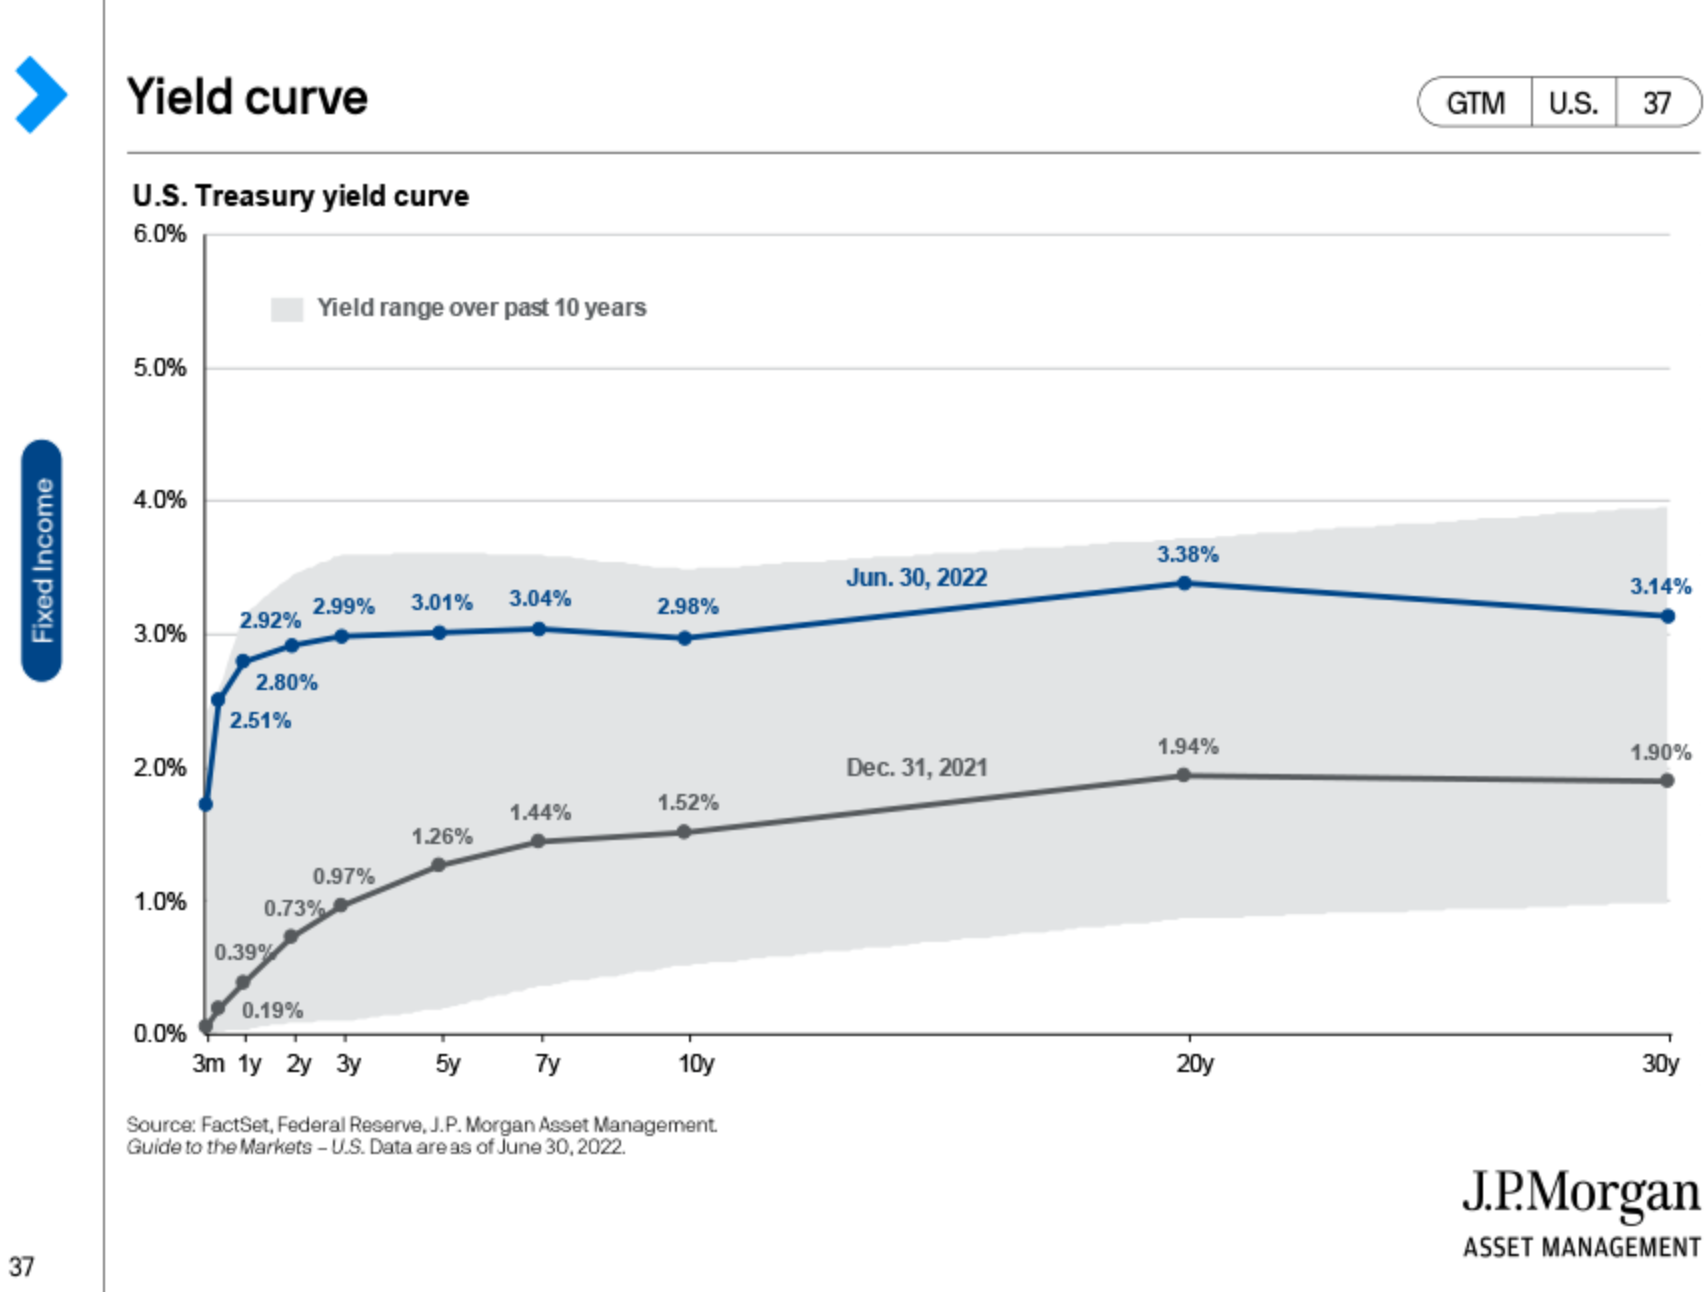
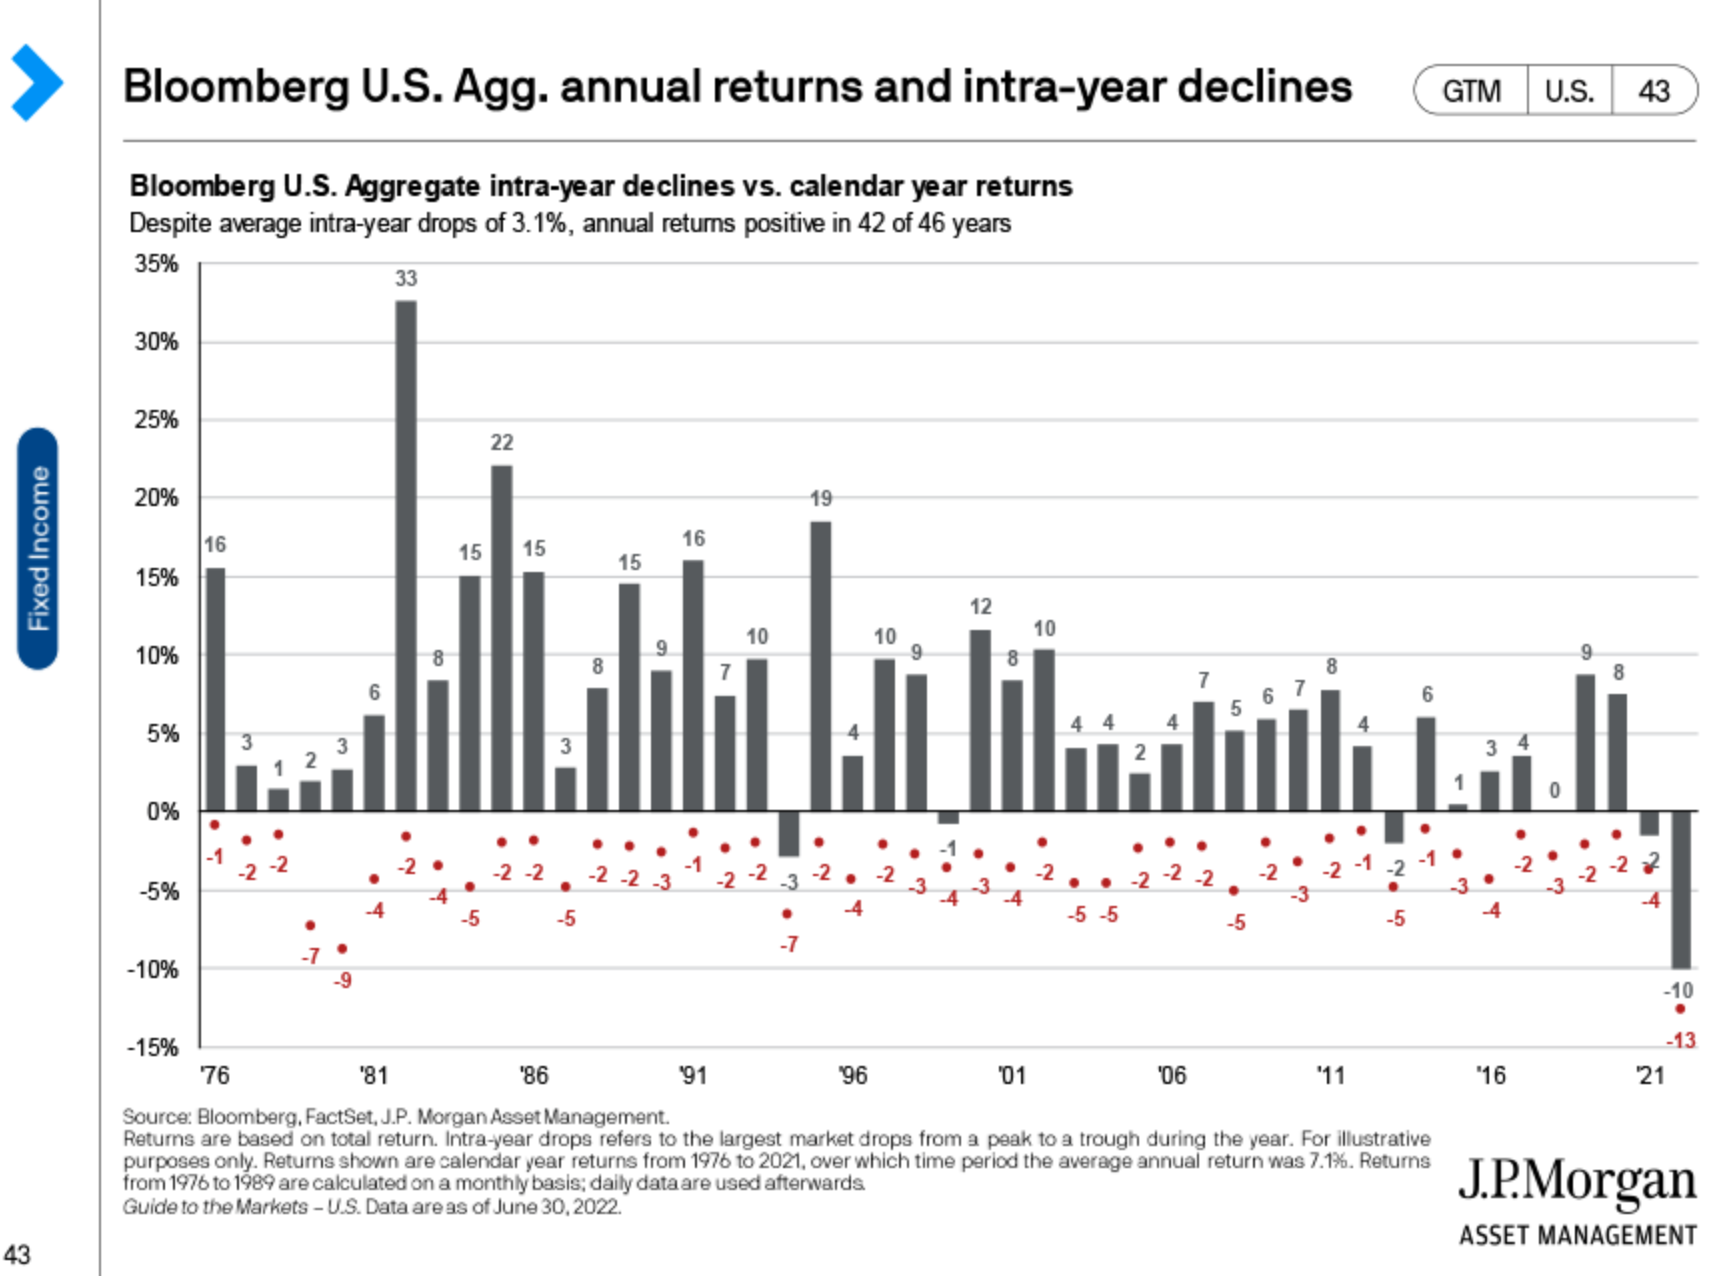
Bond yields are now higher (first chart) making future bond returns more attractive, although it has come at a price as you can see (second chart) how bad of a year this has been for bonds compared to others.
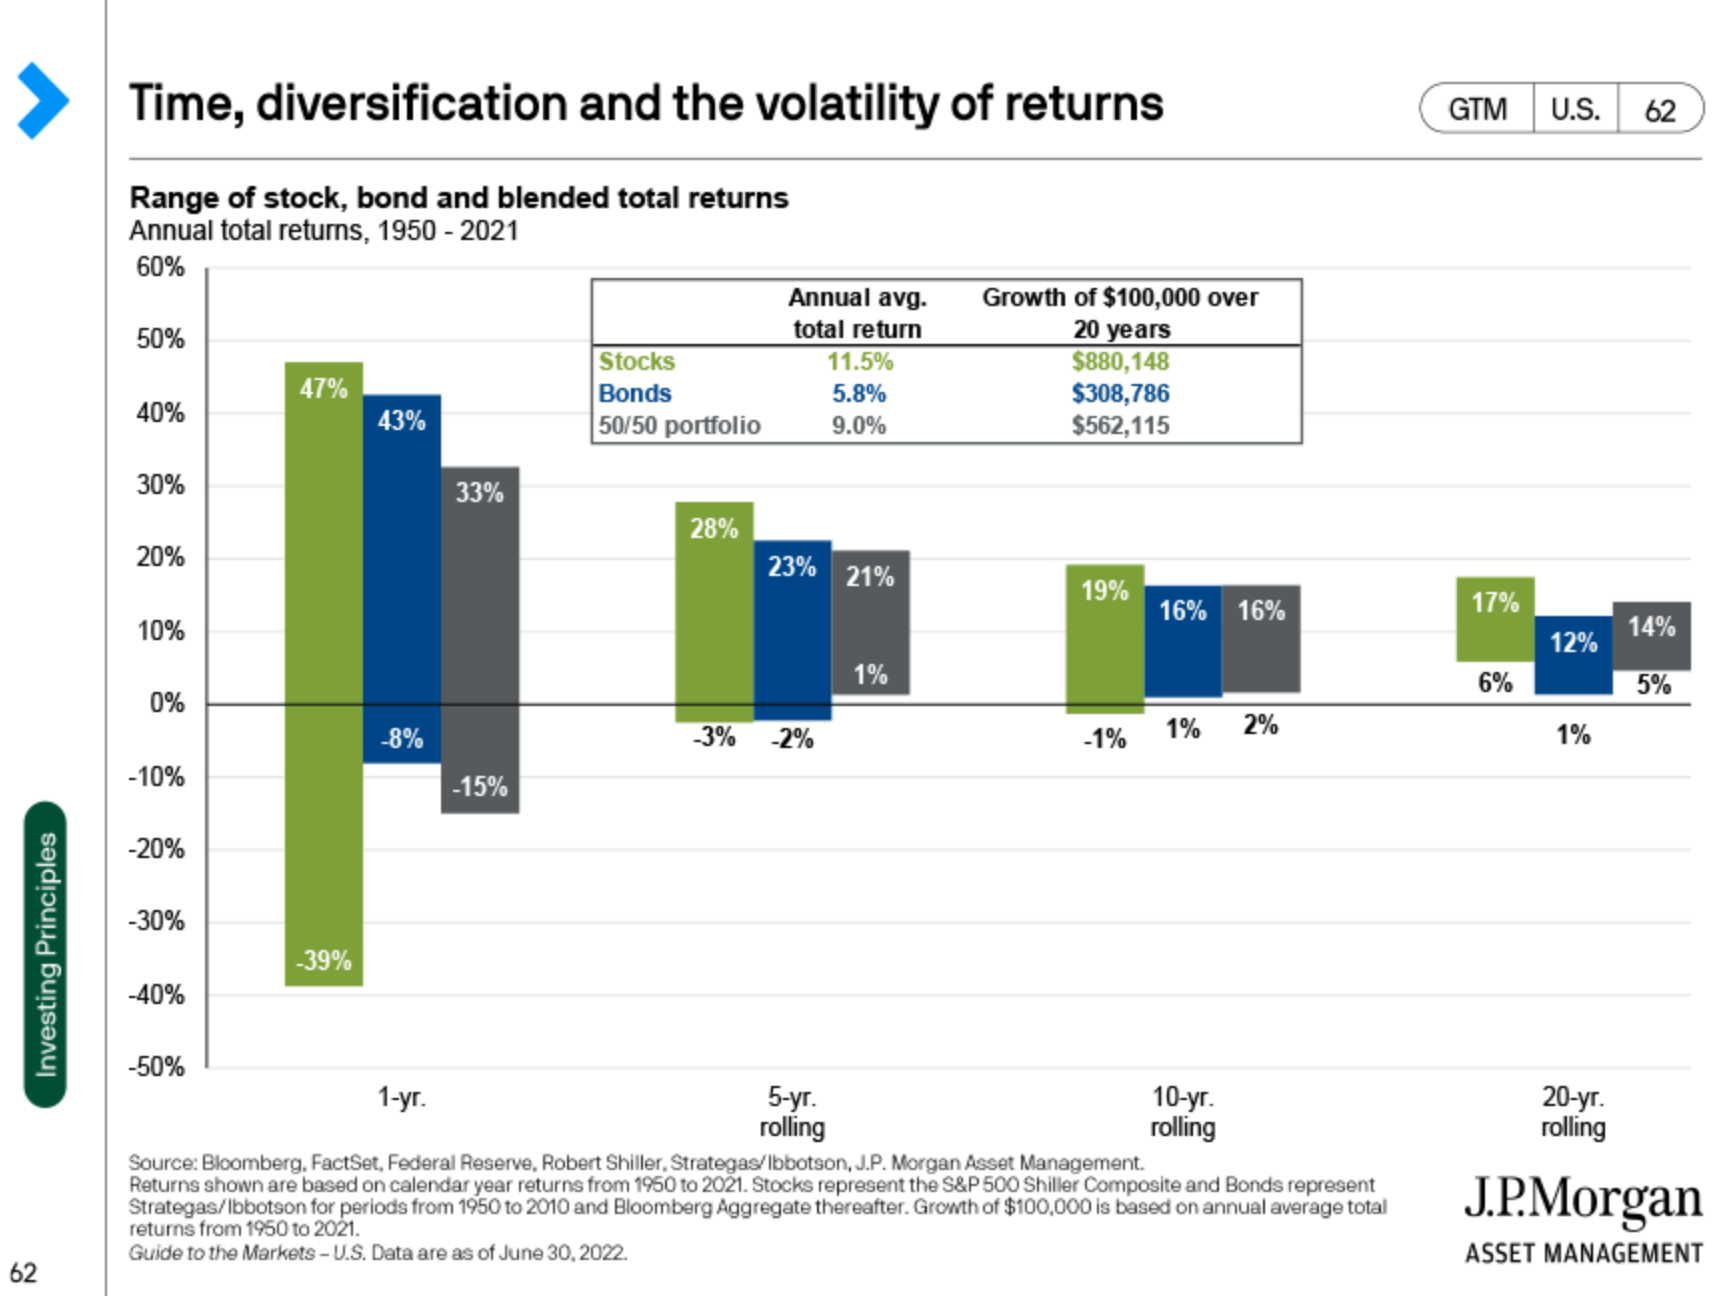
A favorite chart. Don’t let short-term volatility shake you out of earning the market’s long-term returns.
This is really an amazing chart. Consumer confidence by political affiliation during the last 22 years. Republicans are more confident when their party controls the White House. So are Democrats. And they are both less confident when their party doesn’t control the White House.