Every quarter, J.P. Morgan Asset Management puts out their Guide to the Markets slide deck. It’s a great source of interesting and helpful information about the economy, markets, and investing. Here are the Q4 2021 market guide slides that stood out to me and how they may help you.
The Charts
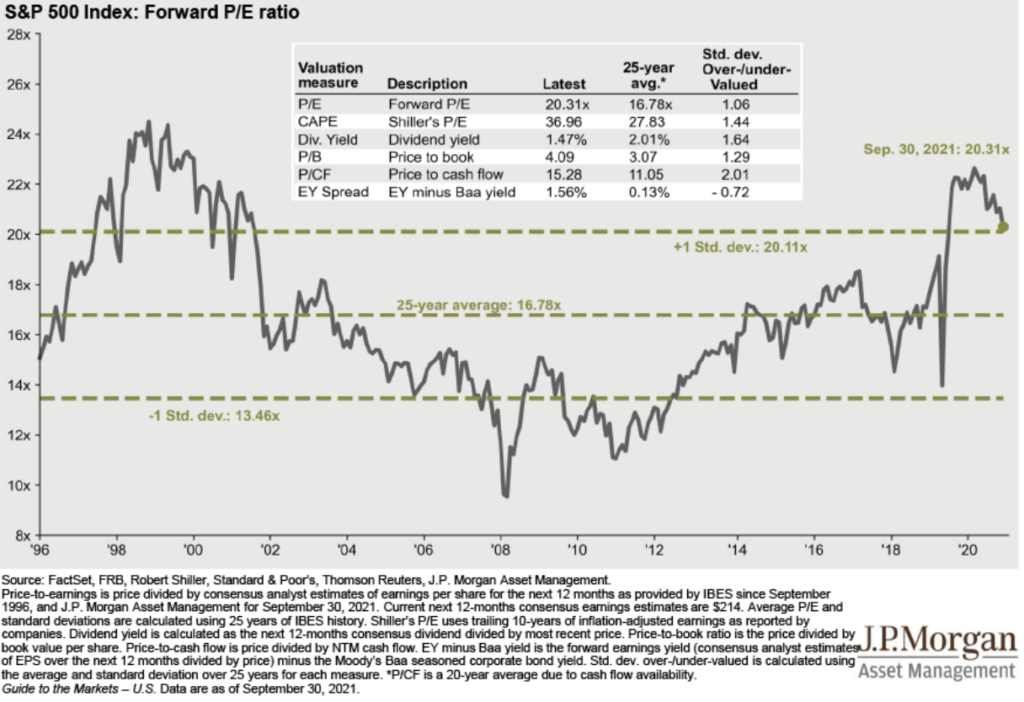
Looking at different valuation measures for the S&P 500 indicates that U.S. large cap stocks are expensive relative to history, albeit by different degrees depending on your chosen valuation method. Interesting to note the EY Spread. Comparing the earnings yield on stocks to what you can get in corporate bond yields is a way of adjusting for the low interest rate environment. Earnings Yield is the inverse of P/E ratios – earnings divided by price. In a low rate environment, like the one we are in, stocks are arguably more attractive. That’s what the EY spread is showing.
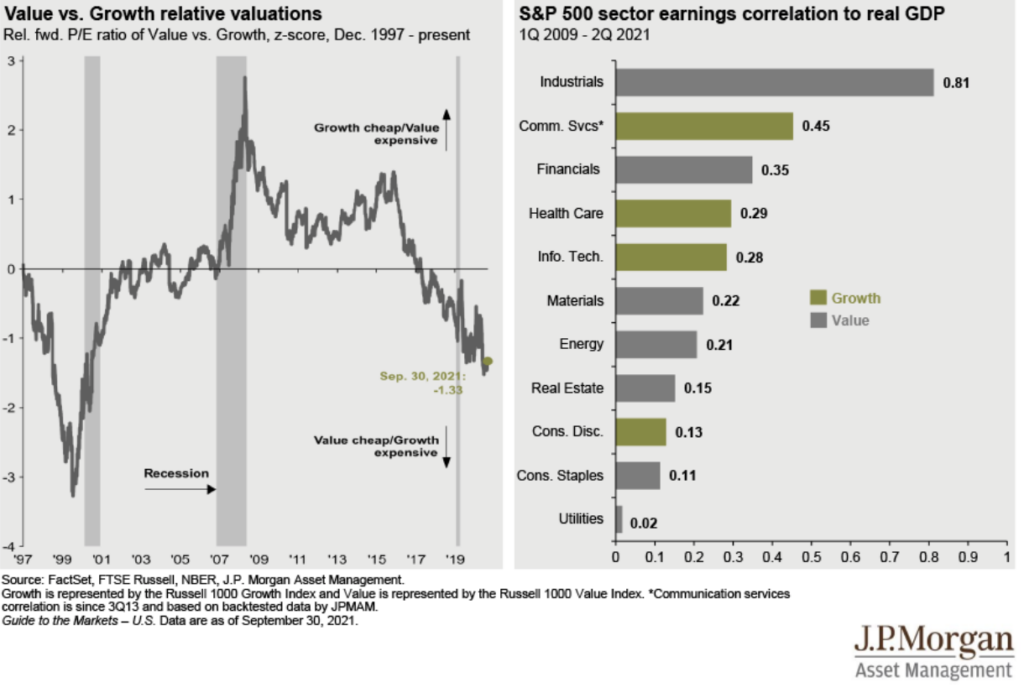
The chart on the left shows that value stocks are still cheap relative to growth stocks.
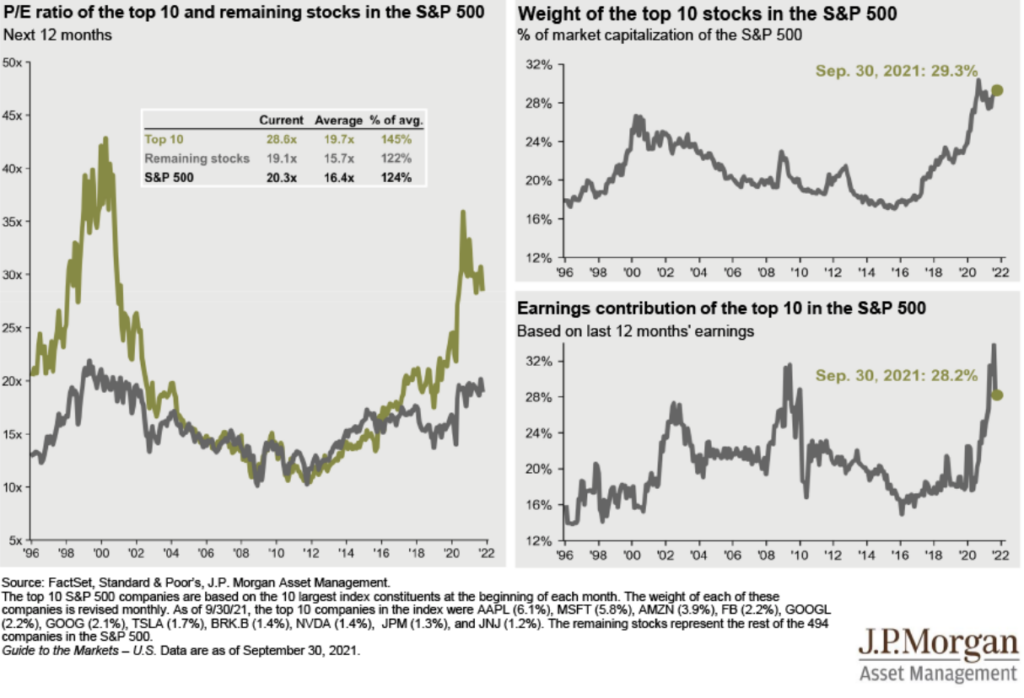
Concerned about valuations and the market? Diversify. The top ten names in the S&P 500 are far more expensive than the rest of the market, are a bigger share of the index than they were before, and are a large contributor to the S&P 500’s earnings.
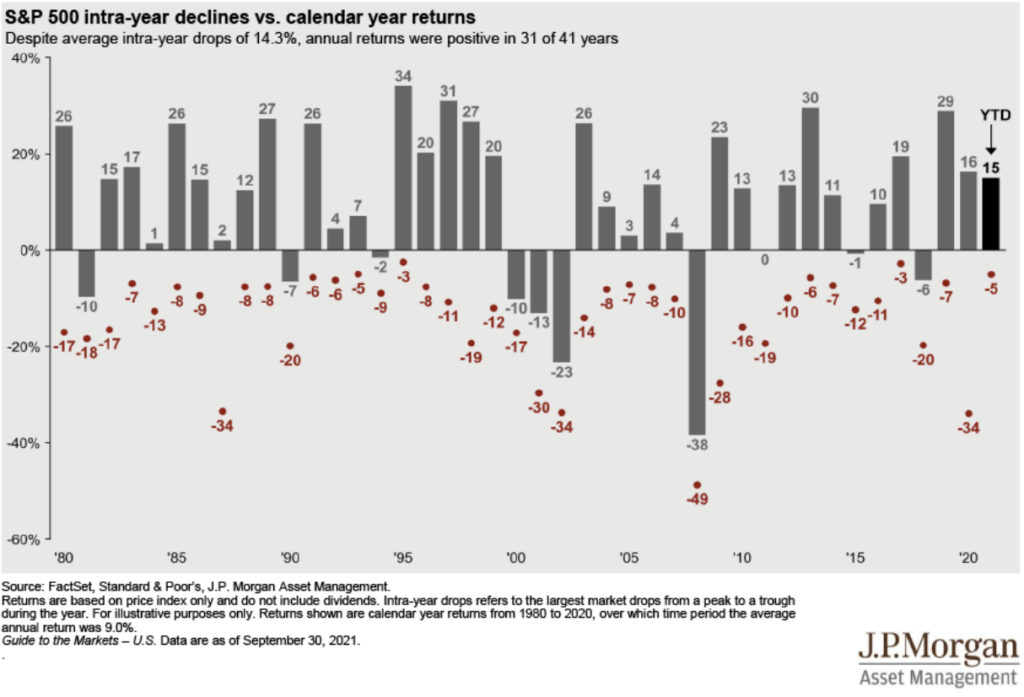
This is one of my favorite slides in the Q4 2021 market guide. Over the last forty years, the market averages a 14.3% intra-year decline. You have to expect annual double digit corrections every year as a stock market investor and learn not to overreact to them. So far this year, we have had very little downside as the largest decline has been 5%.
Inflation.
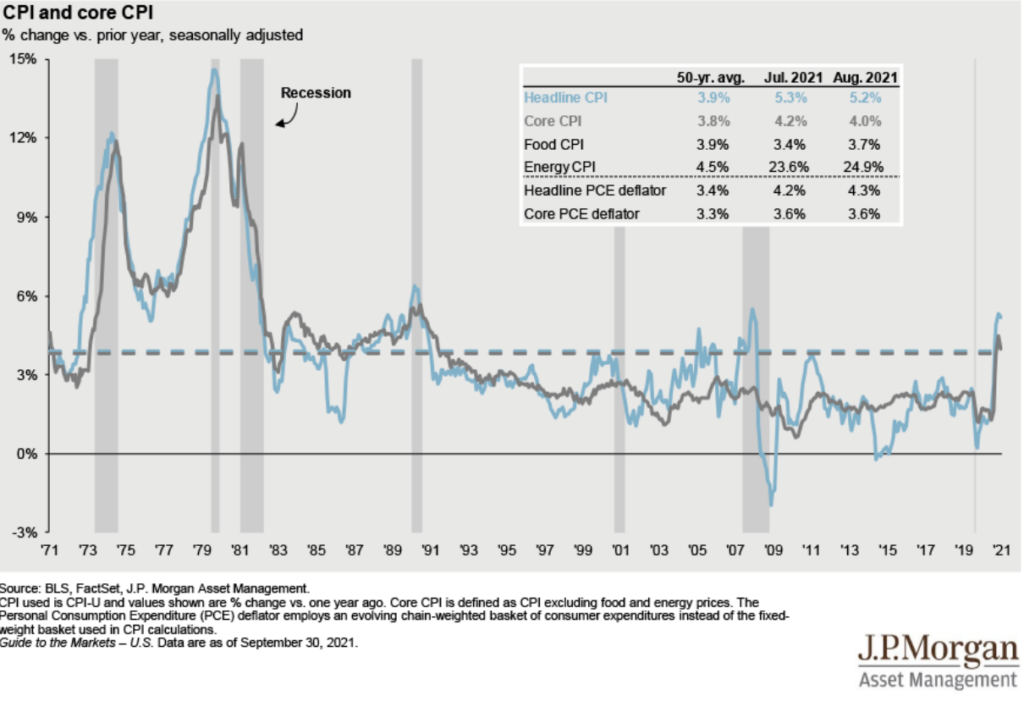
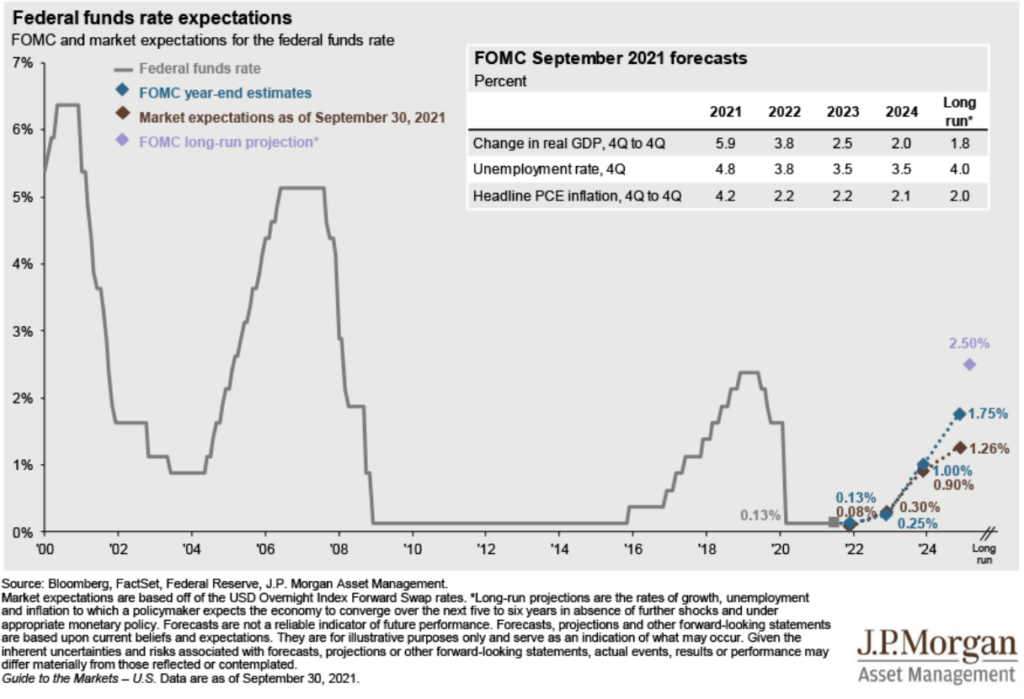
We may still be two years away from Fed rate hikes and the low rate environment is projected to still have a ways to go.
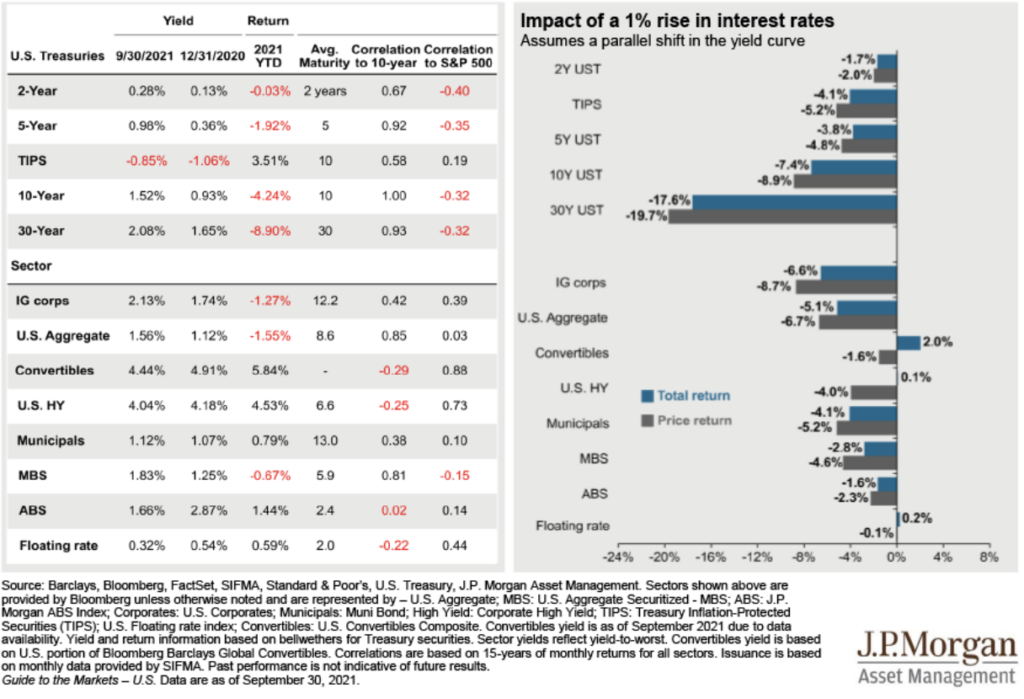
Bonds have struggled this year, which is the chart on the left. If rates increase, bonds will continue to struggle, which is the chart on the right. Here’s what you can do instead of watching your bonds struggle. 5 Portfolio Changes to Consider Now.
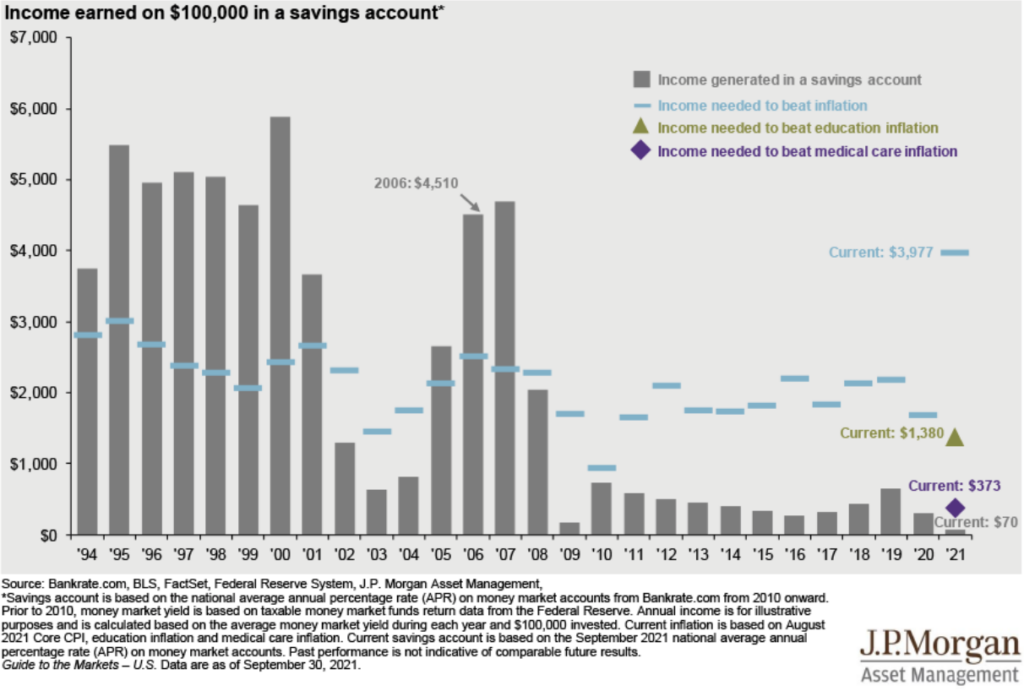
Cash in the bank isn’t earning anything. Get it working. It’s The Easiest Way to Increase Your Investment Returns.
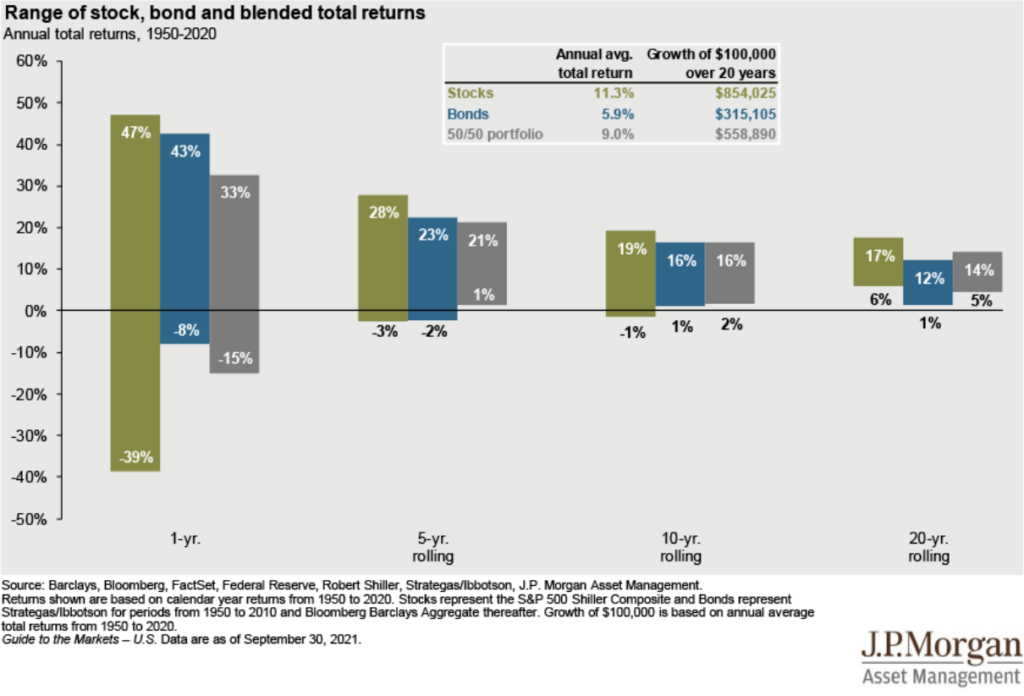
Another favorite. Don’t let short-term volatility shake you out of earning the market’s long-term returns.
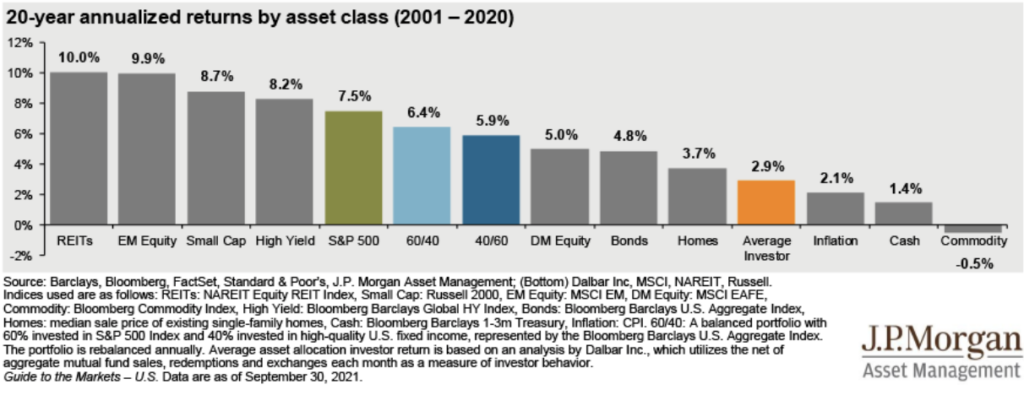
Patience continued…the average investor underperforms almost every type of investment by poor timing decisions and chasing winners.
Wondering how long to give an investment strategy so you don’t jump ship at the wrong time? Check out How Long to Give an Investment Strategy.
Need to make some portfolio changes?
Don’t go it alone